In 2021, we published the Nairobi Metropolitan Area Commercial Office Report 2021 themed “Market under Pandemic, in which we highlighted the performance of the sector in 2020, as well as giving insights on the outlook and areas best fit for investment opportunities. According to the report, the sector’s performance softened in 2020 recording a 0.5% points decline in average rental yields to 7.0% in 2020, from 7.5% in 2019. Occupancy rates declined as well by 2.6% points to 77.7% in 2020, from 80.3% realized in 2019. Also, asking rents and prices declined by 3.0% and 2.8% respectively to an average of Kshs 93 and Kshs 12,280 per SQFT in 2020, from Kshs 96 and Kshs 12,638 per SQFT in 2019. The drop in performance was mainly attributed to a challenging financial environment that led to reduced spending patterns, coupled with an oversupply of 7.3 mn SQFT forcing landlords to reduce rates in a bid to attract and retain existing clients.
This week we will update our research with the Commercial Office report 2022 themed ‘Changing Working Patterns Driving the Market’, in order to determine the market’s performance by looking at the following:
- Overview of the Commercial Office Sector,
- Commercial Office Supply in the Nairobi Metropolitan Area,
- Commercial Office Performance, by Location and by Grades, and,
- Office Market Outlook and the Investment Opportunity in the Sector.
Section I: Overview of the Commercial Office Sector
In 2021, the Nairobi Metropolitan Area (NMA) commercial office market witnessed an improvement in expansion activities by various firms, and its overall performance, compared to 2020. Additionally, the market witnessed additional supply of office spaces as a result of completed buildings worth 0.5 mn SQFT. Some of the factors that have been driving the increased performance and activities in the market include;
- Reopening of the Economy: The reopening of the economy in 2021 facilitated the full resumption of various business operations. This in turn led to a slight increase in the overall occupancy rates of the commercial office sector, as well as the overall rental yields,
- Positive Demographics: Kenya’s urbanization growth rate is currently at 4.0%, 3.2% points higher than the world’s 1.8% according to the World Bank. This in turn drives the demand for office spaces as a result of people moving into the urban areas,
- Serviced Offices/ Co-Working Spaces: These have been gaining traction in Kenya due to their convenience and flexibility, which in turn makes them attractive to tenants and investors, and,
- Nairobi’s recognition as a regional hub: This has attracted investments from foreigners. In January 2022, Max International Company alongside CCI Group of Companies took up commercial office space at the Garden City Business Park bringing its total occupancy rate to 93.0%.
Conversely, the sector continues to face setbacks such as;
- Remote/ Hybrid Working Model: The remote/hybrid working model which continues to be embraced by some firms, continues to weigh down the overall occupancy rates of office spaces and the overall returns to landlords. Notably, though, a shift to a hybrid working model by companies who had adapted the full remote working model will help boost office occupancy rates,
- Oversupply of the office Space: The addition of office spaces against the existing demand in Nairobi has led to an oversupply of 6.7 mn SQFT in 2021, and in turn affecting the overall occupancy rates of the buildings. Moreover, developers are halting their construction plans as they await the absorption of the existing office spaces,
- Price/ Rent Concessions: As a result of discounts provided by landlords in order to attract and retain clients, rental rates and prices have stagnated or in other instances reduced. As such, this has affected the overall yields generated by various commercial developments, evidenced by average rental rates that stabilized at Kshs 93 per SQFT in 2021, a sign of the rates having not resumed to their pre-COVID prices, which averaged at Kshs 96 per SQFT as at 2019, and,
- Financial Constraints: Access to credit loans continue to be a challenge faced by developers due to the tedious transaction processes and timelines. Moreover, banks continue to tighten their loan lending terms while requesting for more collateral, due to the increasing default rates. According to Central Bank of Kenya’s October-December 2021 Quarterly Economic Review, the Gross Non Performing Loans in the Real Estate sector increased by 21.7% to Kshs 74.7 bn in FY’2021, from Kshs 61.4 bn realized in FY’2020. This therefore leads to longer construction timelines and heavy debts incurred at the end of projects.
Section II: Commercial Office Supply in the Nairobi Metropolitan Area
The supply of new commercial space continued to rise in 2021, with the addition of 3 other commercial buildings offering up to 0.5 mn SQFT of extra space in to the commercial office market. The developments included; Global Trade Centre (GTC) Office Tower and Riverside Square, both located in Westlands, and Karen Green in Karen. We expect the office space supply to further increase in 2022 with the addition of other various developments in the pipeline totaling 0.6 mn SQFT of space. These developments include; The Cube and Sandalwood both located in Riverside, and, One Principal Place and the Piano both located in Westlands. The table below shows some of the notable office completions during the review period as well as incoming spaces:
|
Nairobi Metropolitan Area Commercial Office Space Supply |
||||||
|
Major Commercial Office Completion in 2021 |
Major Incoming Commercial Office Space Supply in 2022 |
|||||
|
# |
Development |
Location |
Size (SQFT) |
Development |
Location |
Size (SQFT) |
|
1 |
Global Trade Centre (GTC) Office Tower |
Westlands |
272,359 |
The Cube |
Riverside |
77,876 |
|
2 |
Riverside Square |
Westlands |
136,907 |
Sandalwood |
Riverside |
250,000 |
|
3 |
Karen Green |
Karen |
69,000 |
One Principal Place |
Westlands |
126,109 |
|
4 |
The Piano |
Westlands |
136,167 |
|||
|
Total |
478,266 |
590,152 |
||||
Source: Cytonn Research/Knight Frank Research
There was an office space over supply of 6.7 mn SQFT in 2021, an 8.2% decrease from the 7.3 mn SQFT realized in 2020. This was attributed to increased demand of physical office spaces as some firms resumed full operations, as well as a decline in the supply of new office developments, which came in at 0.5 mn SQFT in 2021, 37.5% lower than the 0.8 mn SQFT recorded in 2020. The table below summarizes the commercial office space supply over time:
|
Nairobi Metropolitan Area Office Space Analysis |
|||||||||||
|
Year |
2012 |
2013 |
2014 |
2015 |
2016 |
2017 |
2018 |
2019 |
2020 |
2021 |
2022 F |
|
Stock ( Mn Sqft) |
7.7 |
9.7 |
15.4 |
22.9 |
28.9 |
31.8 |
35.5 |
36.3 |
36.4 |
36.8 |
37.4 |
|
Completions ( Mn Sqft) |
1.2 |
2.1 |
5.9 |
7.8 |
6.5 |
3.5 |
4.3 |
1.5 |
0.8 |
0.5 |
0.6 |
|
Vacancy Rate (%) |
9.0% |
10.0% |
10.0% |
11.0% |
12.0% |
16.8% |
16.7% |
19.5% |
22.3% |
22.1% |
23.3% |
|
Vacant Stock ( Mn Sqft) |
0.7 |
1.0 |
1.5 |
2.5 |
3.5 |
5.3 |
5.9 |
7.1 |
8.1 |
8.1 |
8.7 |
|
Occupied Stock (Mn Sqft) |
7.1 |
8.8 |
13.9 |
20.3 |
25.4 |
26.5 |
29.6 |
29.2 |
28.3 |
28.7 |
28.7 |
|
Net Absorption |
1.0 |
1.7 |
5.1 |
6.5 |
5.1 |
1.0 |
3.1 |
(0.4) |
(1.0) |
0.4 |
0.0 |
|
Demand |
1.1 |
1.9 |
5.3 |
6.8 |
5.6 |
1.6 |
3.7 |
0.4 |
(0.2) |
1.2 |
0.8 |
|
Available Supply, AS(T) |
1.7 |
2.6 |
6.5 |
8.8 |
8.4 |
6.3 |
9.0 |
6.7 |
7.1 |
7.9 |
8.0 |
|
Gap, GAP(T) |
(0.5) |
(0.8) |
(1.2) |
(2.1) |
(2.9) |
(4.7) |
(5.2) |
(6.3) |
(7.3) |
(6.7) |
(7.2) |
Source: Cytonn Research/ Building Plan Approvals Data from the Nairobi City County
Section III: Commercial Office Performance, by Location and by Grades
The Commercial Office sector realized an improvement in its overall performance in 2021, with the average rental yields coming in at 7.1%, 0.1 % points higher than the 7.0% recorded in 2020. The average occupancy rates increased as well by 0.2% points to 77.9%, from 77.7% recorded in 2020. The improvement in performance was mainly driven by an improved business environment following the lifting of the COVID-19 containment measures, as well as some businesses resuming full operations hence boosting the occupancy rates. The table below summarizes the performance of the commercial office theme over time:
(All Values in Kshs Unless Stated Otherwise)
|
Commercial Office Performance Over Time |
|||||||||
|
Year |
2013 |
2015 |
2016 |
2017 |
2018* |
2019 |
2020 |
2021 |
y/y ∆ 2021 |
|
Occupancy (%) |
90.0% |
89.0% |
88.0% |
82.6% |
83.8% |
80.3% |
77.7% |
77.9% |
0.2% |
|
Asking Rents (Kshs/SQFT) |
95 |
97 |
97 |
101 |
101 |
96 |
93 |
93 |
0.0% |
|
Average Prices (Kshs/SQFT) |
12,433 |
12,776 |
12,031 |
12,649 |
12,407 |
12,638 |
12,280 |
12,279 |
0.0% |
|
Node Average Rental Yields (%) |
8.3% |
8.1% |
8.5% |
7.9% |
8.3% |
7.5% |
7.0% |
7.1% |
0.1% |
Source: Cytonn Research
- Commercial Office Performance by Nodes
In 2021, We classified the main office nodes in the Nairobi Metropolitan Area into 9 nodes: i) Nairobi CBD, ii) Westlands, covering environs including Riverside, iii) Parklands, iv) Mombasa Road, v) Thika Road, vi) Upperhill, vii) Karen, viii) Gigiri, and ix) Kilimani, which includes offices in Kilimani, Kileleshwa and Lavington.
The table below shows the Nairobi Metropolitan Area (NMA) sub-market performance;
(All Values in Kshs Unless Stated Otherwise)
|
NMA Commercial Office Submarket Performance 2021 |
|||||||||||
|
Area |
Price /SQFT (Kshs) 2020 |
Rent /SQFT (Kshs) 2020 |
Occupancy 2020 |
Rental Yields 2020 |
Price Kshs/ SQFT 2021 |
Rent Kshs /SQFT 2021 |
Occupancy 2021(%) |
Rental Yield 2021 |
∆ in Rent |
∆ in Occupancy |
∆ in Rental Yields |
|
Gigiri |
13,400 |
116 |
82.5% |
8.5% |
13,500 |
119 |
81.3% |
8.6% |
2.3% |
(1.2%) |
0.1% |
|
Westlands |
11,975 |
104 |
74.4% |
7.8% |
11,972 |
104 |
75.5% |
8.1% |
0.4% |
1.1% |
0.3% |
|
Karen |
13,567 |
106 |
83.6% |
7.8% |
13,325 |
106 |
83.0% |
7.7% |
(0.4%) |
(0.6%) |
(0.1%) |
|
Parklands |
10,958 |
93 |
79.9% |
7.6% |
11,336 |
91 |
80.1% |
7.6% |
(1.4%) |
0.2% |
0.0% |
|
Kilimani |
12,233 |
93 |
79.1% |
6.8% |
12,364 |
91 |
79.8% |
7.1% |
(1.5%) |
0.7% |
0.3% |
|
Upperhill |
12,684 |
92 |
78.5% |
6.9% |
12,409 |
94 |
78.0% |
7.0% |
2.2% |
(0.5%) |
0.2% |
|
Nairobi CBD |
11,889 |
82 |
82.4% |
6.8% |
11,787 |
82 |
82.8% |
6.8% |
(0.7%) |
0.4% |
0.0% |
|
Thika Road |
12,500 |
80 |
76.1% |
5.8% |
12,571 |
79 |
76.3% |
5.7% |
(1.8%) |
0.2% |
(0.1%) |
|
Mombasa road |
11,313 |
73 |
63.0% |
4.8% |
11,250 |
73 |
64.2% |
5.1% |
0.6% |
1.2% |
0.3% |
|
Node Averages |
12,280 |
93 |
77.7% |
7.0% |
12,279 |
93 |
77.9% |
7.1% |
0.0% |
0.2% |
0.1% |
Source: Cytonn research
Key take-outs include;
- Key to note, Gigiri and Westlands were the best performing nodes with average rental yields of 8.6% and 8.1%, respectively, compared to the market average of 7.1%, in 2021. This was mainly attributed to the presence of high quality offices attracting high rents.
- On the other hand, Mombasa Road was the worst performing node with average rental yields of 5.1% in 2021, 2.0% points lower than the market average of 7.1%. This was mainly driven by; i) the low average rents at Kshs 73.0 per SQFT compared to the market average of Kshs 93 per SQFT, ii) zoning regulations as Mombasa Road is mainly considered an industrial area thus making it unattractive to business firms, and iii) current traffic snarl-ups caused by the ongoing Nairobi Expressway project thus making the area unattractive. However this is a temporary situation as we expect the area to record improved performance upon the completion of the project.
- Karen and Thika Road were the only nodes to record declines in rental yield, both declining by 0.1% points to 7.7% and 5.7%, respectively. This was mainly attributable to a decline in their rents by 0.4% and 1.8%, respectively.
- Commercial Office Performance by Class/Grade:
Commercial office buildings are classified into three main categories based on the size and quality of office spaces. These are:
- Grade A: These are high quality office buildings characterized by their adequate amenities, facilities, and finishes. They therefore fetch higher rental rates and yields compared to other office types. Also these office building sizes range from 100,001 - 300,000 SQFT,
- Grade B: These office buildings have their sizes ranging between 50,000 to 100,000 SQFT. They have good amenities and services, however not as good as Grade A offices, hence charge moderate rental rates, and,
- Grade C: These buildings are usually old, hence their lack of adequate services and facilities. Usually, they charge rents below the average market rate.
From our analysis, Grade B office spaces still account for a majority office spaces in Nairobi, with the current market share being 56.0%. However, this is a 1.8% points decline from the 57.8% share recorded in 2020, as a result of the increased completions of Grade A offices such as the GTC Office Tower in Westlands. For the individual nodes, Gigiri has the highest percentage of Grade A offices at 60.0%, whereas Kilimani has the highest percentage of Grade B offices at 81.8%. For Grade C, Mombasa Road accounts for majority of the office spaces with a current market share of 55.6%. In terms of concentration, Parklands has the highest mix of office types, having recorded 21.1%, 52.6%, and 26.3% of Grade A, Grade B, and Grade C office spaces. The distribution of various office classes/grades is as summarized in the table below: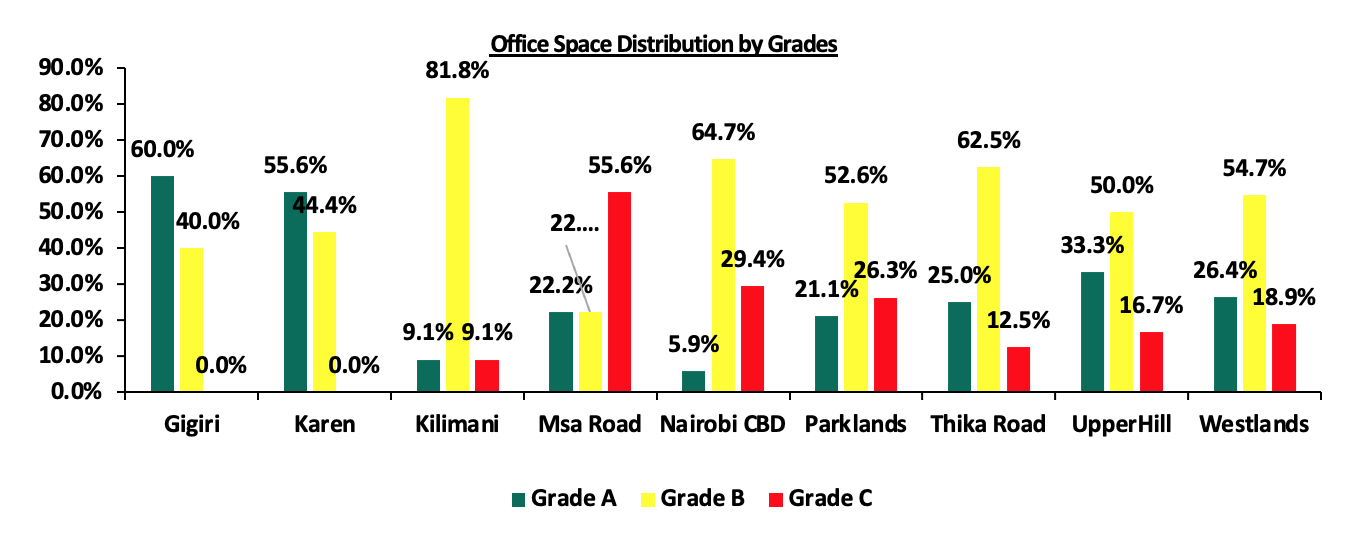
Source: Cytonn Research
In terms of performance;
- Grade A and B office spaces had the highest rental yields at 7.5% as tenants prefer them because of their relative better technical services in comparison to Grade C office spaces,
- Grade A offices recorded the highest overall increase in occupancy rates by 3.1% points in 2021 to 79.4% from the 76.3% realized in 2020 as a result of increased demand, and,
- For rental rates, Grade C offices recorded the largest drop in the average rental rates by 3.3% which in turn led to the largest drop in rental yields by 0.2% points in the period of focus.
The performance according to grades/class is as summarized in the table below:
(All Values in Kshs Unless Stated Otherwise)
|
Commercial Office Performance Based On Grades |
|||||||||||
|
Office Grade |
Price 2020 Kshs/SQFT |
Rent 2020 Kshs/SQFT |
Occupancy 2020 (%) |
Rental Yield 2020 |
Price 2021 Kshs/SQFT |
Rent 2021 Kshs/SQFT |
Occupancy 2021 (%) |
Rental Yield (%) 2021 |
∆ Rent Y/Y |
∆ Occupancy Y/Y (% points) |
∆ Rental Yield Y/Y (%points) |
|
Grade A |
13,628 |
101 |
76.3% |
6.8% |
12,674 |
99 |
79.4% |
7.5% |
(1.8%) |
3.1% |
0.7% |
|
Grade B |
12,202 |
96 |
78.7% |
7.5% |
12,340 |
97 |
78.2% |
7.5% |
(1.1%) |
(0.5%) |
0.0% |
|
Grade C |
10,721 |
85 |
74.3% |
6.8% |
10,839 |
82 |
74.3% |
6.6% |
(3.3%) |
0.0% |
(0.2%) |
Source: Cytonn Research
- Commercial Office Performance by Class and Node:
In 2021, Grade A offices in Gigiri, Karen and Parklands offered the highest average rental yields all at 8.2%, and Westlands at 7.8%. This was attributed to their superior locations characterized by serene environment attracting high-end clients and premium rates, coupled with the presence of adequate amenities and infrastructure servicing the areas. The Grade B offices in Gigiri and Westlands had the highest rental yields of 9.0% and 8.6%, respectively, whereas for the Grade C category, Westlands and Nairobi CBD had the best returns with average rental yields that came in at 7.7% and 7.3%, respectively. The class performance by node is as summarized in the table below with the best performing areas of each grade highlighted in yellow:
|
Commercial Office Performance in 2021 by Nodes and Grades |
||||||
|
|
Grade A |
Grade B |
Grade C |
|||
|
Row Labels |
Average of Occupancy (%) |
Average of Rental Yield |
Average of Occupancy (%) |
Average of Rental Yield |
Average of Occupancy (%) |
Average of Rental Yield |
|
Gigiri |
77.5% |
8.2% |
85.1% |
9.0% |
- |
- |
|
Karen |
85.8% |
8.2% |
80.3% |
7.4% |
- |
- |
|
Parklands |
84.8% |
8.2% |
75.0% |
7.2% |
84.6% |
7.7% |
|
Westlands |
78.2% |
7.8% |
75.6% |
8.6% |
71.8% |
7.2% |
|
Kilimani |
72.5% |
6.2% |
80.7% |
7.2% |
80.0% |
7.2% |
|
Upper Hill |
77.9% |
7.3% |
80.2% |
7.2% |
72.5% |
6.3% |
|
Nairobi CBD |
- |
- |
83.2% |
6.7% |
82.0% |
7.3% |
|
Thika Road |
80.0% |
6.6% |
76.3% |
5.7% |
73.0% |
4.6% |
|
Msa Road |
75.0% |
5.3% |
61.5% |
5.0% |
61.0% |
5.0% |
Source: Cytonn Research
- Serviced Offices
Serviced offices realized a 0.8% Y/Y rental growth to Kshs 183 per SQFT in 2021, from Kshs 161 per SQFT recorded in 2020. In comparison to the unserviced offices which recorded average rents of Kshs 93, the average rents for the serviced offices were higher by 49.2% in 2021. The remarkable performance was mainly attributed to; i) convenience resulting from access to existing facilities, ii) flexibility of the leases, and, iii) no set-up costs required.
Westlands and Karen recorded the highest rent appreciations of 3.9% and 3.1%, respectively, compared to the market average of 0.8% for the serviced offices, due to the presence of quality infrastructure, and facilities attracting prime rents.
All values in Kshs Unless Stated Otherwise
|
Nairobi Metropolitan Area Serviced Office Performance |
||||||
|
Location |
Rent Per SQFT 2020 |
Rent Per SQFT 2021 |
Serviced Offices Rental growth (%) |
Un-serviced Offices Rental growth (%) |
||
|
|
Serviced Offices |
Un-serviced Offices |
Serviced Offices |
Un-serviced Offices |
||
|
Westlands |
204 |
93 |
212 |
104 |
3.9% |
10.6% |
|
Karen |
186 |
104 |
192 |
106 |
3.1% |
1.9% |
|
Parklands |
174 |
106 |
169 |
91 |
(3.3%) |
(16.5%) |
|
Gigiri |
181 |
116 |
- |
119 |
- |
2.5% |
|
Upperhill |
- |
92 |
235 |
94 |
- |
2.1% |
|
Kilimani |
190 |
82 |
194 |
91 |
2.2% |
9.9% |
|
Nairobi CBD |
160 |
93 |
164 |
82 |
2.6% |
(13.4%) |
|
Msa Rd |
105 |
73 |
- |
73 |
- |
0.0% |
|
Thika Rd |
116 |
80 |
112 |
79 |
(3.6%) |
(1.3%) |
|
Nodes Average |
161 |
93 |
183 |
93 |
0.8% |
0.0% |
Source: Cytonn Research
Section IV: Office Market Outlook and the Investment Opportunity in the Sector
Based on the office market supply, demand, performance, and investor returns, we have a NEUTRAL outlook for the commercial office sector theme in Nairobi Metropolitan Area (NMA) mainly due to the 6.7 mn SQFT oversupply of space. However, with most firms and business fully embarking to working from the office amidst the improved economic environment, we expect that this will cushion the performance of the sector. The table below summarizes our outlook on the sector based on the various key driving factors.
|
Nairobi Commercial Office Outlook |
||||
|
Measure |
2020 Sentiment |
2021 Sentiment and 2022 Outlook |
2021 Review |
2022 Outlook |
|
Supply |
We had an oversupply of 7.3 mn SQFT of office space in 2020, and it is expected to grow by 1.1% to 8.0 mn SQFT in 2021, due to reduced occupancy rates brought about by reduced demand as people adopt the working from home alongside the incoming supply which is expected to affect the occupancy rates |
There was an oversupply of 6.7mn SQFT in 2021, an 8.3% decrease from the 7.3 mn SQFT realized in 2020. This was due to increased demand of physical office spaces as some firms resumed full operations. The incoming supply in 2021 came it 0.5 mn SQFT 3.6% lower than the 0.8 mn SQFT recorded in 2020. We expect the office space oversupply to further increase by 9.0% in 2022 to 7.1 mn SQFT, attribute to an expected addition of 0.6 mn SQFT from commercial office buildings that are currently under construction, coupled with an anticipated decline in occupancy rates in 2022 as per Cytonn 2022 Markets Outlook |
Neutral |
Negative |
|
Demand |
There was reduced demand for office space in the Nairobi Metropolitan Area (NMA) evidenced by the 1.3% y/y decline in the average occupancy rates mainly attributable to an oversupply. investment opportunity lies in differentiated concepts such as serviced offices offering yields of up to 11.2% compared to 7.0% average rental yields of Unserviced materials |
There was an increased demand for office spaces, evidenced by the 0.2% increase in the average occupancy rates which came in at 77.9% in 2021, from the 77.7% recorded in 2020. This was mainly attributed to businesses resuming full operations after the lifting of COVID-19 containment measures. In addition to this, the absorption of office spaces increased to 1.2mn SQFT in 2021 from (0.2) mn SQFT recorded in 2020 We however expect the occupancy rates to be weighed down by some businesses still embracing the remote/ hybrid working model, and the market uncertainties due to the incoming general elections |
Neutral |
Neutral |
|
Office Market Performance |
The commercial office sector performance softened in 2020 recording a 0.5% points decline in average rental yields to 7.0% in 2020 from 7.5% in 2019. The average occupancies also declined in 2020 coming in at 77.7%, a 2.6%points decline from 80.3% in 2019. In 2020, we expect average rental prices to drop slightly over the short term due to downward pressure arising from the decline in effective demand from the existing oversupply in the market, and the COVID-19 effects that has caused decline in occupancy rates and yields |
The sector realized a slight improvement in its overall performance in FY’2021, with the average rental yields coming in at 7.1%. We expect that the full resumption of operations by some firms and businesses amidst the improved economy to continue driving the market’s performance. However, the remote working model still being embraced by some firms, coupled with existing oversupply of office spaces currently at 6.7 mn SQFT are expected to weigh down the overall occupancy rates and yields of the sector |
Neutral |
Neutral |
Our outlook for the NMA commercial office sector is NEUTRAL, from negative last year, mainly due to the full resumption of operations by some firms and businesses amidst the improved economy. However, the remote working model still being embraced by some firms, coupled with existing oversupply of office spaces currently at 6.7 mn SQFT are expected to weigh down the overall occupancy rates and yields of the sector. Investment opportunity lies in Gigiri and Karen supported by relatively low supply of office spaces, and high returns of 8.6% and 7.7%, respectively, compared to the market average of 7.1%, as at 2021. For the full Commercial Office Report 2022, click here.
Disclaimer: The views expressed in this publication are those of the writers where particulars are not warranted. This publication, which is in compliance with Section 2 of the Capital Markets Authority Act Cap 485A, is meant for general information only and is not a warranty, representation, advice or solicitation of any nature. Readers are advised in all circumstances to seek the advice of a registered investment advisor.


