In July 2020, we released the Nairobi Metropolitan Area Land Report 2020 which highlighted that in 2019/2020 the land sector recorded an annual capital appreciation of 1.5%, compared to the price correction of 0.3% recorded in 2018/2019, attributed to increased demand for land mainly in the low rise residential areas and satellite towns. Asking land prices in low rise residential areas recorded a 3.8% capital appreciation y/y, attributed to the availability of development land in these areas. Additionally, people are attracted to these areas as they are sparsely populated, thus offering exclusivity and privacy. Unserviced land in satellite towns such as Ruaka also recorded a capital appreciation of 3.8% y/y, attributable to the growing demand for land in these areas fueled by the demand for housing by the growing working population as the areas act as Nairobi’s dormitory, coupled by the improving infrastructure.
This week, we update our report by highlighting the various factors affecting the NMA land sector, market performance based on selling prices and the annual capital appreciation, as well as identify investment opportunities for the sector, using 2021 market research data. Therefore, in this topical we shall focus on;
- Introduction to the Nairobi Metropolitan Area (NMA) Land Sector,
- NMA Land Sector Performance 2021 Based on Various Locations,
- Summary and Investment Opportunity in the Sector, and,
- Conclusion and Outlook for the Sector.
- Introduction to the Nairobi Metropolitan Area (NMA) Land Sector
The Nairobi Metropolitan Area (NMA) land sector registered improvement in activities in 2020/2021 despite the tough economic environment and an oversupply in select sectors of real estate such as the commercial office sector of 7.3mn SQFT. Some of the factors that supported the performance of the sector in 2020/2021 include;
- Improving infrastructure with the government aggressively focusing on the implementation and conclusion of the various projects such as the Lamu Port-South Sudan-Ethiopia Transport (LAPSSET) project whose first berth was completed and launched in May 2021, Nairobi Expressway which is expected to be completed by February 2022 (six months ahead of its initial December 2022 completion date), and, the Western Bypass, among many other projects, which will in turn boost property prices and open up surrounding areas for real estate development,
- The 0.6% and 33.6% improved budget allocation for the infrastructure, and, Housing, Urban Development and Public Works sectors in FY’ 2021/22 to Kshs 182.5 bn and Kshs 21.8 bn, respectively, from the Kshs 181.4 bn and Kshs 16.2 bn allocated in FY’2020/21, respectively. The improved allocations for the sectors is also expected to significantly increase development activities in the infrastructure and housing sectors which in return will source for improved demand for land and its overall upward performance,
- The increasing focus on the affordable housing agenda by the government and other private developers hence creating demand for land especially in the satellite towns of NMA,
- Relatively high population growth rates and urbanization rates of 2.3% and 4.0%, respectively in Kenya, against a global average of 1.1% and 1.9%, respectively, and,
- Reduced supply of development land at affordable prices in areas close to the Nairobi CBD resulting in demand for the same in satellite towns.
Contrary to the aforementioned supporting factors, the sector’s performance was still impeded by;
- Reduced spending power by prospective clients attributed to the tough economic condition brought about by the pandemic hence crippling performance of the sector, in addition to the increased unemployment rate with approximately 0.9 mn people having lost their jobs in 2020, thereby bringing the unemployment rate in Kenya to 36.1% in Q3’2020 from 33.9% in Q3’2019, according to the Quarterly Labour Force Report-Q3’2020 by the Kenya National Bureau of Statistics (KNBS),
- Reduced development activities in the real estate sector in the wake of the pandemic brought about by limited access to financing, and, oversupply in select sectors of real estate such as the commercial office and retail sectors of 7.3 mn SQFT and 3.1 mn SQFT in NMA, respectively, forcing developers halt their plans as they await the absorption of the current space,
- Inadequate infrastructure despite government’s efforts to initiate and implement projects in the infrastructure sector, thereby hindering accessibility and investment opportunities in various parts within the NMA, and,
- High mortgage lending interest rates currently averaging at 10.9%, and longer credit transaction timelines impeding access to loans, thereby also negatively affecting performance of the land sector due to limited purchasing and development power of prospective clients.
Despite the challenges affecting the sector, some of the factors that are likely to shape it going forward include;
- Stamp Duty (Valuation of Immovable Property) Regulations 2020- In a bid to shorten and ease land transaction timelines and processes in Kenya, the National Treasury Secretary, Hon Ukur Yatani published the Stamp Duty (Valuation of Immovable Property) Regulations 2020, in October 2020. In addition to simplifying land transactions, the move also boosts confidence in undertaking land transactions in the country thus improving performance of the land sector through increased demand and uptake, as well as boost prices of various regions,
- Digitization of Land Records- In a bid to curb fraud cases and ease land transaction processes, President Uhuru Kenyatta launched the National Land Information Management System (NLIMS) in April 2021, marking the culmination of years of digitization of land records in Kenya. The launch of the digital land platform named ‘Ardhi Sasa’, which was first rolled out in Nairobi then in other counties in phases, coincided with the opening of the National Geospatial Data Centre, an online depository that will contain all the land records in Kenya, and,
- E-Construction Permit System- The system which also includes the QR code system was launched by City Hall in March 2020 to improve building plan approval performances, however was compromised in June 2021 forcing its operations to be withheld, and has since been under renovation with operations expected to resume in August 2021. With its revamp, it will further enable easier and faster building plan approvals which in return will boost land development activities through various construction activities which initiate improved demand for land.
- NMA Land Sector Performance 2021 Based on Various Locations
For the analysis, we conducted research on various major towns within the NMA and classified them as follows;
- High Rise Residential Areas: They comprise of areas such as Kileleshwa, Dagoretti, Githurai, Embakasi, and Kasarani, and are majorly characterized by the numerous high rise buildings such as the apartments found within,
- Low Rise Residential Areas: These are areas which generally consist of low rise buildings such as the bungalows, maisonettes and villas. They include; Kitisuru, Runda, Ridgeways, Karen and Spring Valley,
- Commercial Zones: They comprise of areas such as Kilimani, Westlands, Riverside and Upperhill, and are popular because of the numerous commercial office buildings that they have, and,
- Satellite Towns: Land in the area was categorized into serviced (site and service schemes) and unserviced land.
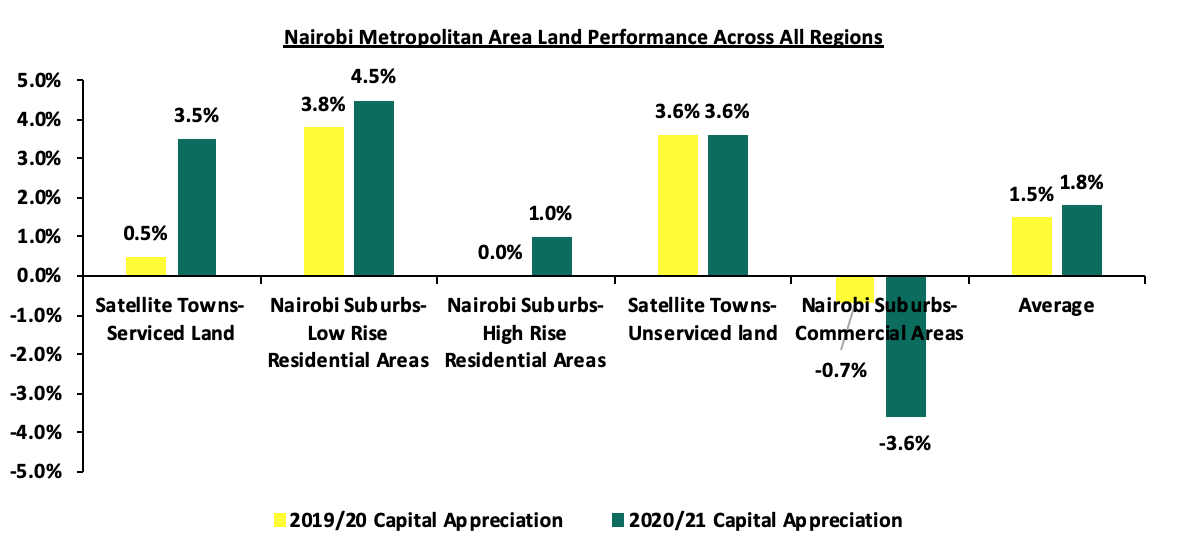
The NMA land sector on overall recorded an average annual capital appreciation of 1.8% in 2020/2021, 0.3% points increase when compared to the 1.5% realized in 2019/2020, with asking prices averaging at Kshs 127.8 mn thereby realizing a 9-year CAGR of 12.2%. The improvement in performance was mainly attributed to the increased demand for land in low rise areas which recorded the highest annualized capital appreciation of 4.6% compared to a market average of 1.8%. However, land prices in the commercial areas of the NMA registered the highest price correction declining by 3.6% attributed to unaffordability with their current average prices coming in at Kshs 404.4 mn compared to a market average of Kshs 127.8 mn, coupled with the limited development activities in the real estate commercial office sector and an oversupply of 7.3mn SQFT as at 2020.
The summary of the performance is as shown below;
The table below shows a 9-year performance summary of the NMA land sector based on the average asking prices, CAGR and capital appreciation;
All Values in Kshs Unless Stated Otherwise
|
Summary of the Land Performance Across All regions in Nairobi Metropolitan Area |
|||||||||||
|
Location |
*Price in 2011 |
*Price in 2015 |
*Price in 2016 |
*Price in 2017 |
*Price 2018/19 |
*Price 2019/20 |
*Price 2020/21 |
CAGR |
2019/20 Capital Appreciation |
2020/21 Capital Appreciation |
∆ in capital appreciation |
|
NMA Low Rise Residential Areas |
35.6 mn |
67.8 mn |
78.4 mn |
82.4 mn |
81.0 mn |
84.2 mn |
87.9 mn |
10.6% |
3.8% |
4.5% |
0.6% |
|
Satellite Towns-Unserviced land |
4.2 mn |
9.5 mn |
12.8 mn |
13.8 mn |
14.2 mn |
14.7 mn |
15.2 mn |
15.4% |
3.6% |
3.6% |
0.0% |
|
Satellite Towns-Serviced land |
5.5 mn |
12.7 mn |
14.0 mn |
15.0 mn |
14.2 mn |
15.0 mn |
15.7 mn |
13.3% |
0.5% |
3.5% |
3.0% |
|
NMA High Rise Residential Areas |
52.6 mn |
91.4 mn |
109.2 mn |
117.0 mn |
116.6 mn |
115.6 mn |
115.8 mn |
9.7% |
0.0% |
1.0% |
0.6% |
|
Commercial Areas- NMA |
145.0 mn |
359.3 mn |
421.8 mn |
433.0 mn |
421.0 mn |
419.0 mn |
404.6 mn |
12.3% |
(0.7%) |
(3.6%) |
(3.0%) |
|
Average |
48.6 mn |
108.1 mn |
127.2 mn |
132.2 mn |
129.4 mn |
129.7 mn |
127.8 mn |
12.2% |
1.5% |
1.8% |
0.3% |
|
· The NMA land sector on overall recorded an average annual capital appreciation of 1.8% in 2020/2021, a 0.3% points increase when compared to the 1.5% realized in 2019/2020 mainly attributed to the increased demand for land in low rise areas which recorded the highest price appreciation of 4.5% when compared to the market average capital appreciation of 1.8% |
|||||||||||
Source: Cytonn Research
Performance per node:
- Nairobi Suburbs-Low Rise Residential Areas
The average asking prices and annual capital appreciation for land in the low rise areas came in at Kshs 87.9 mn and 4.5%, respectively, in 2020/2021. The performance was attributable to; i) serene environments hence attracting high end income earners, ii) sufficient amenities, iii) adequate infrastructure boosting investment opportunities and price boosts and, iv) their strategic locations in sparsely populated zones hence enhancing privacy. Kitisuru was the best performing node registering annual capital appreciation of 6.3%, a 3.3% points higher than the 3.0% recorded in 2019/2020, attributable to the increasing demand and accessibility of the area due to improving infrastructure.
All values is Kshs unless stated otherwise
|
Land Performance-Low Rise Residential Areas in Nairobi Metropolitan Area 2020/21 |
|||||||||||
|
Location |
*Price in 2011 |
*Price in 2015 |
*Price in 2016 |
*Price in 2017 |
*Price 2018/19 |
*Price 2019/20 |
*Price 2020/21 |
CAGR |
2019/20 Capital Appreciation |
2020/21 Capital Appreciation |
∆ in capital appreciation |
|
Kitisuru |
32.0 mn |
59.0 mn |
70.0 mn |
70.0 mn |
71.0 mn |
73.0 mn |
77.9 mn |
10.4% |
3.0% |
6.3% |
3.3% |
|
Karen |
25.0 mn |
40.0 mn |
46.0 mn |
52.0 mn |
53.0 mn |
56.0 mn |
59.0 mn |
10.0% |
5.6% |
5.1% |
(0.5%) |
|
Ridgeways |
24.0 mn |
51.0 mn |
62.0 mn |
68.0 mn |
65.0 mn |
66.0 mn |
68.8 mn |
12.4% |
1.8% |
4.0% |
2.2% |
|
Runda |
33.0 mn |
58.0 mn |
67.0 mn |
68.0 mn |
68.0 mn |
70.0 mn |
72.8 mn |
9.2% |
3.3% |
3.8% |
0.5% |
|
Spring Valley |
64.0 mn |
131.0 mn |
147.0 mn |
154.0 mn
|
148.0 mn |
156.0 mn |
161.0 mn |
10.8% |
5.4% |
3.1% |
(2.3%) |
|
Average |
35.6 mn |
67.8 mn |
78.4 mn |
82.4 mn |
81.0 mn |
84.2 mn |
87.9 mn |
10.6% |
3.8% |
4.5% |
0.6% |
|
· Low rise residential areas registered the highest capital appreciation of 4.5% against the market average of 1.8% in 2020/2021 attributed to their serene environment, adequate infrastructure and amenities, and strategic location enhancing privacy · Kitisuru was the best performing node registering annual capital appreciation of 6.3%, a 3.3% points higher than the 3.0% recorded in 2019/2020, attributable to the increasing demand and accessibility of the area due to improving infrastructure |
|||||||||||
Source: Cytonn Research
- Satellite Towns-Unserviced Land
The unserviced land in satellite towns recorded an average annualized capital appreciation of 3.6% in 2020/2021 with the average asking prices coming in at Kshs 15.2 mn, thereby realizing a 9-year CAGR of 15.4%. The performance was mainly driven by factors such as affordability when compared to areas such as the low and high rise areas which registered average asking prices of Kshs 87.9 mn and Kshs 115.8 mn, respectively, urban sprawl, and improving infrastructure servicing the areas. Ruiru was the best performing node registering highest annual market capital appreciation and average selling prices of 6.9% and Kshs 23.6 mn, respectively, mainly attributable to the availability of infrastructure supporting easier access to the area such as the Thika Super Highway, and, increased demand for land to develop student housing facilities as the area serves various educational centers among other factors.
All values is Kshs unless stated otherwise
|
Land Performance-Satellite Towns in Nairobi Metropolitan Area- Unserviced Land |
|||||||||||
|
Location |
*Price in 2011 |
*Price in 2015 |
*Price in 2016 |
*Price in 2017 |
*Price 2018/19 |
*Price 2019/20 |
*Price 2020/21 |
CAGR |
2019/20 Capital Appreciation |
2020/21 Capital Appreciation |
∆ in capital appreciation |
|
Ruiru |
7.0 mn |
15.0 mn |
19.0 mn |
20.0 mn |
21.0 mn |
22.0 mn |
23.6 mn |
14.5% |
6.2% |
6.9% |
0.7% |
|
Juja |
3.0 mn |
7.0 mn |
9.0 mn |
10.0 mn |
10.0 mn |
10.0 mn |
10.6 mn |
15.1% |
3.4% |
5.5% |
2.1% |
|
Athi River |
2.0 mn |
3.0 mn |
4.0 mn |
4.0 mn |
4.0 mn |
4.0 mn |
4.2 mn |
8.6% |
3.4% |
5.1% |
1.7% |
|
Utawala |
6.0 mn |
9.0 mn |
10.0 mn |
11.0 mn |
12.0 mn |
12.0 mn |
12.4 mn |
8.4% |
4.1% |
3.2% |
(0.9%) |
|
Limuru |
5.0 mn |
13.0 mn |
17.0 mn |
20.0 mn |
20.0 mn |
21.0 mn |
21.2 mn |
17.4% |
2.9% |
1.0% |
(1.9%) |
|
Ongata Rongai |
2.0 mn |
10.0 mn |
18.0 mn |
18.0 mn |
18.0 mn |
19.0 mn |
19.0 mn |
28.4% |
1.6% |
0.0% |
(1.6%) |
|
Average |
4.2 mn |
9.5 mn |
12.8 mn |
13.8 mn |
14.2 mn |
14.7 mn |
15.2 mn |
15.4% |
3.6% |
3.6% |
0.0% |
|
· The unserviced land in satellite towns recorded an average annualized capital appreciation 3.6% in 2020/2021 with the average asking prices coming in at Kshs 15.2 mn, thereby realizing a 9-year CAGR of 15.4% · Ruiru was the best performing node registering highest annual market capital appreciation and average selling prices of 6.9% and Kshs 23.6 mn, respectively, mainly attributable to the availability of infrastructure supporting easier access to the area such as the Thika Super Highway, and, increased demand for land to develop student housing facilities as the area serves various educational centers among other factors |
|||||||||||
Source: Cytonn Research
- Satellite Towns-Serviced Land
Serviced land performance in NMA’s satellite towns registered a 9-year CAGR of 13.3%, with asking prices coming in at Kshs 15.7 mn in 2020/2021, 4.7% points up from the Kshs 15.0 mn recorded in 2019/2020, whereas average annual capital appreciation came in at 3.5%. Performance in the sector was mainly driven by the relatively affordable selling prices, improving infrastructure and positive demographics. Additionally, serviced land offers greater investment opportunity attributable to the advantage of easier accessibility to amenities such as water, drainage systems and, electricity among many other amenities, hence performance better when compared to unserviced land performance of similar areas. Ongata Rongai registered the highest annual capital appreciation of 8.9% when compared to the market average of 3.5% signifying robust demand for land in the area by a growing middle income class, positive demographics and, availability of infrastructure with the area being served by the Magadi Road which is opening the area for real estate development.
All values is Kshs unless stated otherwise
|
Land Performance-Satellite Towns in Nairobi Metropolitan Area- Serviced Land |
|||||||||||
|
Location |
*Price in 2011 |
*Price in 2015 |
*Price in 2016 |
*Price in 2017 |
*Price 2018/19 |
*Price 2019/20 |
*Price 2020/21 |
CAGR |
2019/20 Capital Appreciation |
2020/21 Capital Appreciation |
∆ in capital appreciation |
|
Ongata Rongai |
7.0 mn |
16.0 mn |
19.0 mn |
19.0 mn |
19.0 mn |
18.0 mn |
19.8 mn |
12.2% |
(3.8%) |
8.9% |
12.7% |
|
Athi River |
2.0 mn |
11.0 mn |
13.0 mn |
13.0 mn |
12.0 mn |
12.0 mn |
13.1 mn |
23.2% |
3.5% |
8.7% |
5.2% |
|
Ruiru |
8.0 mn |
18.0 mn |
19.0 mn |
21.0 mn |
23.0 mn |
24.0 mn |
25.3 mn |
13.6% |
5.8% |
5.2% |
(0.6%) |
|
Thika |
5.0 mn |
7.0 mn |
8.0 mn |
10.0 mn |
10.0 mn |
10.0 mn |
10.4 mn |
8.5% |
0.5% |
3.5% |
3.0% |
|
Syokimau-Mlolongo |
3.0 mn |
12.0 mn |
12.0 mn |
12.0 mn |
12.0 mn |
12.0 mn |
11.8 mn |
16.4% |
(3.8%) |
(1.4%) |
2.4% |
|
Ruai |
8.0 mn |
12.0 mn |
13.0 mn |
15.0 mn |
14.0 mn |
14.0 mn |
13.5 mn |
6.0% |
1.0% |
(3.6%) |
(4.6%) |
|
Average |
5.5 mn |
12.7 mn |
14.0 mn |
15.0 mn |
15.0 mn |
15.0 mn |
15.7 mn |
13.3% |
0.5% |
3.5% |
3.0% |
|
· Ongata Rongai registered the highest annual capital appreciation of 8.9% when compared to the market average of 3.5% signifying robust demand for land in the area by a growing middle income class, positive demographics and, availability of infrastructure with the area being served by the Magadi Road which is opening the area for real estate development |
|||||||||||
Source: Cytonn Research
- Nairobi Suburbs- High Rise Residential Areas
Land in the high rise residential areas of Nairobi recorded an annualized capital appreciation of 1.0% in 2020/2021 from 0.0% annualized price appreciation in 2019/2020, with asking prices registering a slight improvement to Kshs 115.8 mn from Kshs 115.6 mn registered in 2019/2020, attributable to the slight increase in the demand for land in the areas. Embakasi was the best performing node registering annual capital appreciation of 6.3% against the market average of 1.0% attributable to positive demographics, a fast growing middle income class with disposable income, and an improving infrastructure with the area being serviced by roads such as the Outering road and Manyanja road among many others.
All values is Kshs unless stated otherwise
|
Land Performance-High Rise Residential Areas in Nairobi Metropolitan Area 2020/21 |
|||||||||||
|
Location |
*Price in 2011 |
*Price in 2015 |
*Price in 2016 |
*Price in 2017 |
*Price 2018/19 |
*Price 2019/20 |
*Price 2020/21 |
CAGR |
2019/20 Capital Appreciation |
2020/21 Capital Appreciation |
∆ in capital appreciation |
|
Embakasi |
33.0 mn |
61.0 mn |
60.0 mn |
70.0 mn |
61.0 mn |
63.0 mn |
67.2 mn |
8.2% |
(4.4%) |
6.3% |
10.7% |
|
Kasarani |
32.0 mn |
51.0 mn |
60.0 mn |
64.0 mn |
66.0 mn |
65.0 mn |
67.7 mn |
8.7% |
5.7% |
3.9% |
(1.8%) |
|
Kileleshwa |
149.0 mn |
227.0 mn |
286.0 mn |
306.0 mn |
311.0 mn |
303.0 mn |
300.9 mn |
8.1% |
(2.6%) |
(0.7%) |
1.9% |
|
Githurai |
21.0 mn |
37.0 mn |
45.0 mn |
46.0 mn |
45.0 mn |
44.0 mn |
43.5 mn |
8.4% |
(1.4%) |
(1.2%) |
0.2% |
|
Dagoretti |
28.0 mn |
81.0 mn |
95.0 mn |
99.0 mn |
100.0 mn |
103.0 mn |
99.7 mn |
15.2% |
2.5% |
(3.3%) |
(5.8%) |
|
Average |
52.6 mn |
91.4 mn |
109.2 mn |
117.0 mn |
116.6 mn |
115.6 mn |
115.8 mn |
9.7% |
0.0% |
1.0% |
1.0% |
|
· Embakasi was the best performing node registering annual capital appreciation of 6.3% against the market average of 1.0% attributable to positive demographics, a fast growing middle income class with disposable income, and an improving infrastructure with the area being serviced by roads such as the Outering road and Manyanja road among many others |
|||||||||||
Source: Cytonn Research
- Nairobi Suburbs- Commercial Zones
The commercial zones recorded a 3.6% price correction in the average asking prices of land from Kshs 419.0 mn in 2019/2020 to 404.6 mn in 2020/2021. The performance is majorly attributed to the reduced development activities coupled with the existing oversupply of 7.3 mn SQFT and 3.1 mn SQFT of space in NMA’s commercial office and retail sectors, respectively, thereby crippling investment opportunity in the areas, which in return has resulted to a decline in the demand for land. Additionally, due to the existing oversupply, developers have halted their plans to allow for absorption of the current space.
All values is Kshs unless stated otherwise
|
Land Performance-Commercial Zones in Nairobi Metropolitan Areas 2020/21 |
|||||||||||
|
Location |
*Price in 2011 |
*Price in 2015 |
*Price in 2016 |
*Price in 2017 |
*Price 2018/19 |
*Price 2019/20 |
*Price 2020/21 |
CAGR |
2019/20 Capital Appreciation |
2020/21 Capital Appreciation |
∆ in capital appreciation |
|
Westlands |
150.0 mn |
350.0 mn |
453.0 mn |
474.0 mn |
430.0 mn |
421.0 mn |
413.6 mn |
11.9% |
(1.9%) |
(1.8%) |
0.1% |
|
Upper Hill |
200.0 mn |
450.0 mn |
512.0 mn |
510.0 mn |
488.0 mn |
506.0 mn |
487.3 mn |
10.4% |
3.8% |
(3.8%) |
(7.6%) |
|
Kilimani |
114.0 mn |
294.0 mn |
360.0 mn |
387.0 mn |
403.0 mn |
398.0 mn |
381.7 mn |
14.4% |
(1.2%) |
(4.3%) |
(3.1%) |
|
Riverside |
116.0 mn |
343.0 mn |
362.0 mn |
361.0 mn |
363.0 mn |
351.0 mn |
335.7 mn |
12.5% |
(3.3%) |
(4.6%) |
(1.3%) |
|
Average |
145.0 mn |
359.3 mn |
421.8 mn |
433.0 mn |
421.0 mn |
419.0 mn |
404.6 mn |
12.3% |
(0.7%) |
(3.6%) |
(3.0%) |
|
· The commercial zones recorded a 3.6% price correction in the average asking prices of land from Kshs 419.0 mn in 2019/2020 to 404.6 mn in 2020/2021 attributable to reduced development activities and existing oversupply of 7.3 mn SQFT and 3.1mn SQFT of space in NMA’s commercial office and retail sectors, respectively · Despite this, Westlands registered a 0.1% improvement in its Y/Y capital appreciation to (1.8%) in 2020/21 from (1.9%) registered in 2019/2020, attributable to the robust growth of its infrastructure sector such as the development of the Nairobi Expressway opening up areas for investment opportunities, adequate amenities, and, its close proximity to Nairobi’s Central Business District (CBD) |
|||||||||||
Source: Cytonn Research
- Summary and Investment Opportunity in The Sector
The table below summarizes the performance of the various areas:
|
Summary and Conclusions- y/y Capital Appreciation Nairobi Metropolitan Area |
|
|
Unserviced Land Capital Appreciation |
|
|
2020/2021 |
Areas |
|
>5.0% |
Ruiru, Juja, Athi River, Kitisuru, Karen, Embakasi |
|
1.0%- 4.9% |
Limuru, Utawala, Ridgeways, Runda, Spring Valley, Kasarani |
|
<1.0% |
Githurai, Dagorreti, Kileleshwa, Kilimani, Westlands, Riverside, Upper Hill |
|
Site and Service Capital Appreciation |
|
|
2020/2021 |
Areas |
|
>5.0% |
Athi River, Ongata Rongai, Ruiru |
|
1.0%- 4.9% |
Thika |
|
<1.0% |
Ruai, Syokimau- Mlolongo |
Source: Cytonn Research
Investment Opportunity
- Low rise residential areas- The investment opportunity in this sector lies in Kitisuru which recorded the highest annual capital appreciation of 6.3% against the market average attributed to the relatively high demand as well as relatively affordable prices having recorded an average market selling price of Kshs 77.9 mn against the market average of Kshs 87.9 mn,
- Satellite towns (unserviced land)- The investment opportunity in this sector lies in Ruiru submarket which registered the highest Y/Y capital appreciation and average selling prices of 6.9% and Kshs 23.6 mn mainly attributable to the adequate infrastructure supporting easier access and investment opportunities, with the area being served with roads such as Thika superhighway, and, increased demand for land to develop student housing facilities as the area serves various educational centers among other factors,
- Satellite towns (serviced land)- Ongata Rongai and Athi River present the best investment opportunity having recorded capital appreciations of 8.9% and 8.7%, respectively, in 2020/2021 against the 1.7% market average, attributable to robust demand by the existing growing middle class coupled with the adequacy and ease of access to amenities,
- High rise residential areas- Embakasi presents a greater investment opportunity in this sector having recorded the highest Y/Y capital appreciation of 6.3% attributed to a growing middle income with disposable income, positive demographics and improving infrastructure, and,
- Commercial zones- Westlands presents the best investment opportunity in this sector having registered a 0.1% improvement in its Y/Y capital appreciation to (1.8%) in 2020/2021 from (1.9%) registered in 2019/2020, attributable to the robust growth of its infrastructure sector such as the development of the Nairobi Expressway opening up areas for investment opportunities, adequate amenities, and, its close proximity to Nairobi’s Central Business District (CBD).
- Conclusion and Outlook for The Sector
|
Indicator |
2020 Projections |
2021 Projections |
2020 Outlook |
2021 Outlook |
|
Infrastructure Development |
|
|
Neutral |
Positive |
|
Legal Reforms |
|
|
Positive |
Positive |
|
Credit Supply |
|
|
Negative |
Negative |
|
Real Estate Activities |
|
|
Neutral |
Neutral |
|
Performance |
|
|
Neutral |
Positive |
We have three positive outlooks for infrastructure development, legal reforms and land sector performance, one neutral outlook for real estate activities and one negative outlook for credit supply bringing the total outlook of the sector to POSITIVE. We therefore expect its performance to be further boosted by robust infrastructure activities ongoing, increased demand for developments going forward and positive demographics, despite factors such as reduced spending power owed to the tough economic conditions and the inadequate infrastructure in some areas of the country still impeding its performance.
Disclaimer: The views expressed in this publication are those of the writers where particulars are not warranted. This publication, which is in compliance with Section 2 of the Capital Markets Authority Act Cap 485A, is meant for general information only and is not a warranty, representation, advice or solicitation of any nature. Readers are advised in all circumstances to seek the advice of a registered investment advisor.


