According to the International Monetary Fund (IMF), the Sub Saharan economy is projected to grow at a rate of 3.8% in 2022. The projection remains unchanged from the initial April projection of 3.8%, and significantly lower than the 4.6% growth rate recorded in 2021. The downward revision comes on the back of sustained supply constraints, worsened by persistent geopolitical pressures given that most countries in the Sub-Saharan Africa are net importers. The challenges have continued to exacerbate fiscal deficits in most countries leading to increased debt sustainability concerns in Sub-Saharan Africa as the region’s public debt to GDP ratio increased to 61.0% in 2021, from 60.0% in 2020. The public debt is expected to remain high due to increased debt serving costs coupled with continued currency depreciations and increased interest rates in developed economies.
Currency Performance
In Q3’2022, most of the selected Sub-Saharan currencies continued to depreciate against the US Dollar, mainly due to the increased inflationary pressures in majority of the countries on the back of persistent supply chain constraints. The Ghanaian Cedi was the largest decliner YTD and over the last twelve months, losing 66.1% and 67.8%, respectively, mainly as a result of a deteriorated macro-economic environment, characterized by high inflation which stood at 33.9% in August 2022, against the Ghana Central Bank target rate of 6.0 - 10.0%. Ghana also continues to face debt sustainability concerns with public debt to GDP ratio coming in at 84.6% as of July 2022, coupled with a downgrade of Ghana’s credit outlook ratings by both Moody and Fitch to negative. The Zambian kwacha was the only currency which appreciated against the US Dollar, gaining by 5.9% year to date, mainly attributable to positive investor confidence following Zambia’s improved macroeconomic performance and strong trade surplus driven by higher copper price earnings. Key to note, the Kenya Shilling depreciated by 6.7% in Q3’2022 to close at Kshs 120.7 against the US Dollar, compared to Kshs 113.2 recorded at the beginning of the year. Below is a table showing the performance of select African currencies:
|
Select Sub Saharan Africa Currency Performance vs USD |
|||||
|
Currency |
Sep-21 |
Jan-22 |
Sep-22 |
Last 12 Months change (%) |
YTD change (%) |
|
Zambian Kwacha |
16.7 |
16.7 |
15.8 |
6.0% |
5.9% |
|
Tanzanian Shilling |
2303.9 |
2,304.5 |
2,327.0 |
(1.0%) |
(1.0%) |
|
Mauritius Rupee |
42.4 |
43.6 |
45.6 |
(7.5%) |
(4.6%) |
|
Nigerian Naira |
410.2 |
412.4 |
431.9 |
(5.3%) |
(4.7%) |
|
Kenyan Shilling |
110.5 |
113.1 |
120.7 |
(9.2%) |
(6.7%) |
|
Ugandan Shilling |
3543.6 |
3,544.6 |
3,851.3 |
(8.7%) |
(8.7%) |
|
Botswana Pula |
11.3 |
11.7 |
13.3 |
(17.9%) |
(13.7%) |
|
South African Rand |
15.0 |
15.9 |
18.1 |
(20.4%) |
(13.8%) |
|
Malawian Kwacha |
815.2 |
816.8 |
1,008.8 |
(23.7%) |
(23.5%) |
|
Ghanaian Cedi |
6.0 |
6.1 |
10.1 |
(67.8%) |
(66.1%) |
Source: S&P Capital
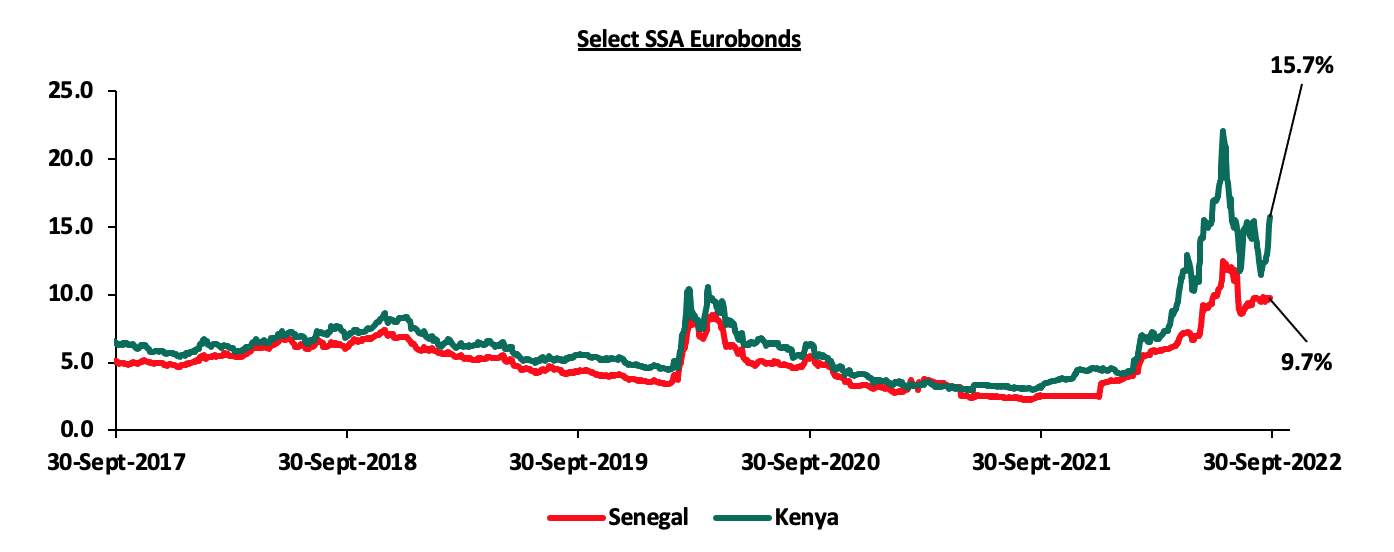
African Eurobonds
Africa’s appetite for foreign-denominated debt has declined in recent times as no country issued a bond during Q3’2022, with most countries shying away from the Eurobonds market due to sustained high yields translating to high borrowing costs. The significant increase in yields is partly attributable to investors attaching higher risk premium on the Sub-Saharan Countries issues, driven by increased inflationary pressures, and continued depreciation of local currencies on the back of persistent supply chain constraints, as well as sustained debt unsustainability concerns. Yields on the Kenyan and Senegal Eurobonds increased in Q3’2022 by 11.3% points and 7.3% points to 15.7% and 9.7%, from 4.4% and 2.4%, respectively, recorded at the end of December 2021. Below is a 5-year graph showing the Eurobond secondary market performance of select 10-year Eurobonds issued by Kenya and Senegal:
Source: S&P Capital
Equities Market Performance
Sub-Saharan Africa (SSA) stock markets recorded mixed performance in Q3’2022, with Zambia’s stock market (LASILZ) being the best performing market gaining by 28.7% YTD due to improved macroeconomic conditions that have led to favorable investor sentiments in the country. Ghana’s GGSECI was the worst-performing market with a loss of 46.7% YTD, largely driven by sell offs from investors following adverse macroeconomic conditions in Ghana driven by high inflation at 33.9% as of August 2022. Kenya’s NASI declined by 28.0% at the end of Q3’2022, mainly attributable to increased foreign investor sell offs coupled with increased uncertainties emanating from inflationary pressures as well as the heated political temperature that surrounded the August elections. Below is a summary of the performance of key indices:
|
Equities Market Performance (Dollarized*) |
||||||
|
Country |
Index |
Sep-21 |
Jan-22 |
Sep-22 |
Last 12 Months change (%) |
YTD change (%) |
|
Zambia |
LASILZ |
294.5 |
362.2 |
466.2 |
58.3% |
28.7% |
|
Nigerian |
NGSEASI |
98.1 |
104.1 |
113.5 |
15.8% |
9.0% |
|
Rwanda |
RSEASI |
0.1 |
0.1 |
0.1 |
(0.7%) |
(0.8%) |
|
Tanzanian |
DARSDEI |
0.8 |
0.6 |
0.6 |
(28.8%) |
(6.5%) |
|
Uganda |
USEASI |
0.4 |
0.4 |
0.3 |
(23.1%) |
(18.0%) |
|
South Africa |
JALSH |
4280.2 |
4,639.6 |
3,524.9 |
(17.6%) |
(24.0%) |
|
Kenya |
NASI |
1.6 |
1.5 |
1.1 |
(34.1%) |
(28.0%) |
|
Ghana |
GGSECI |
472.4 |
454.6 |
242.5 |
(48.7%) |
(46.7%) |
|
*The index values are dollarized for ease of comparison |
||||||
Source: S&P Capital
GDP growth in Sub-Saharan Africa region is expected to weaken, as debt sustainability concerns remain elevated. The region’s debt to GDP ratio increased to 61.0% of GDP in 2021, from 60.0% of GDP in 2020 making it less attractive to foreign capital. The significant weakening of the currencies has also increased the cost of servicing debt.


