Following the release of the H1’2021 results by Kenyan listed banks, the Cytonn Financial Services Research Team undertook an analysis on the financial performance of the listed banks and identified the key factors that shaped the performance of the sector.
Core Earnings per Share (EPS) recorded a weighted increase of 136.0% in H1’2021, from a weighted decline of 33.6% recorded in H1’2020. The significant growth in earnings is attributable to reduced provisioning levels by the listed banks following the relatively stable business operating environment during the period. The performance in H1’2021 is however skewed by the strong performance from ABSA, KCB Group, and Equity Group, which recorded core EPS growths of 846.0%, 101.9% and 97.7%, respectively.
The report is themed “Reduced Provisioning levels Spur Earnings Growth” where we assess the key factors that influenced the performance of the banking sector in H1’2021, the key trends, the challenges banks faced, and areas that will be crucial for growth and stability of the banking sector going forward. As such, we shall address the following:
- Key Themes That Shaped the Banking Sector Performance in H1’2021,
- Summary of The Performance of the Listed Banking Sector in H1’2021,
- The Focus Areas of the Banking Sector Players Going Forward, and,
- Brief Summary and Ranking of the Listed Banks based on the Outcome of Our Analysis.
Section I: Key Themes That Shaped the Banking Sector Performance in H1’2021
Below, we highlight the key themes that shaped the banking sector in H1’2021 which include; regulation, regional expansion through mergers and acquisitions, asset quality deterioration and capital raising for onward lending:
- Regulation :
- Closure of Loan restructuring Window: The loan restructuring window as per the Banking Circular No 3 of 2020 by the Central Bank of Kenya provided to commercial banks and mortgage finance companies on loan restructuring came to an end on March 2nd 2021, having seen a total of loans worth Kshs 1.7 tn restructured, representing 57.0% of the banking sector’s loan book. With this expiry, the banks are now back to normal loan risk management. However, despite the expiry of the loan restructuring window, some banks still supported their borrowers during the period with Equity Group, KCB Group and ABSA Bank Kenya cumulatively restructuring loans amounting to approximately Kshs 339.1 bn as at H1’2021;
|
No. |
Bank |
Cumulative Amount Restructured* (Kshs bn) |
% of Restructured loans to Gross loans |
Performing Restructured Loans (Kshs bn) |
% of Performing Restructured loans |
H1’2021 y/y Change in Loan loss provision |
|
1 |
Equity Group Holdings |
171.0 |
31.0% |
103.0 |
60.2% |
(63.7%) |
|
2 |
KCB Group |
106.1 |
15.9% |
95.8 |
90.3% |
(40.3%) |
|
3 |
ABSA Bank Kenya |
62.0 |
26.7% |
55.5 |
89.5% |
(63.9%) |
|
|
Total |
339.1 |
|
254.3 |
75.0% |
|
|
*Cumulative amount of loans restructured since the loan restructuring window opened in March 2020 |
||||||
- Regional Expansion through Mergers and Acquisitions: The Kenyan banks are looking at having an extensive regional reach and to this end, the following were the major M&A’s activities announced in H1’2021:
- On 3rd May 2021, I&M Group announced that it completed the 90.0% acquisition of Orient Bank Limited Uganda (OBL) share capital, after receiving all the required regulatory approvals. As highlighted in our Cytonn Weekly #50/2020, I&M Group was set to pay Kshs 3.6 bn for the deal. However, the final cost is expected to be higher after the base price was adjusted to take into account multiple factors such as appreciation of the Ugandan shilling against the US dollar, integration support, the short-term financial performance of the subsidiary and the sale of its property. I&M Group will take over 14 branches from OBL, taking its total branches to 89, from 66 branches as at the end of 2020. For more information, please see Cytonn Weekly #18/2021, and,
- On 16th May 2021, Equity Group disclosed that it had acquired an additional 7.7% stake valued at Kshs 996.0 mn in Equity bank Congo (EBC) from the German Sovereign Wealth Fund (KfW). The acquisition raised the total ownership in EBC to 94.3%, indicating that they valued the company at Kshs 14.2 bn. This follows the acquisition of 66.5% stake in Banque Commerciale Du Congo (BCDC) by Equity Group at a cost of Kshs 10.2 bn in August 2020. For more information, please see Cytonn Weekly#20/2021.
Other mergers and acquisitions activities announced after H1’2021 include;
- On 25th August 2021, KCB Group announced that it had completed the 62.1% acquisition of Banque Populaire du Rwanda Plc (BPR), after receiving all the required regulatory approvals. KCB Group and Atlas Mara Limited had signed a definitive agreement in November 2020 for KCB’s acquisition of a 62.1% stake in BPR and a 100.0% stake in Africa Banking Corporation Tanzania Limited (BancABC), subject to shareholder approval and regulatory approval in the respective countries. In May 2021, KCB Group disclosed that it made an offer to the remaining BPR shareholders to raise its acquisition stake in the bank to 100.0% from 62.1% and received shareholders’ approval for the acquisitions, with only regulatory approval pending for the finalization of the transactions. Regulatory approval is however still pending with respect to the KCB’s acquisition of BancABC from Atlas Mara. As highlighted in our Cytonn Weekly #29/2021 and Cytonn Weekly #19/2021, KCB Group agreed to purchase 62.1% stake in BPR from Atlas Mara Limited using a Price to Book Value (P/Bv) of 1.1x. According to the latest BPR financials released as of June 2021, the bank had a book value of Rwf 52.9 bn (Kshs 5.8 bn), and thus at the trading multiple of 1.1x, we expect KCB Group to have spent an estimated Kshs 6.3 bn to acquire BPR Rwanda. For BanABC’s acquisition, KCB will pay to the seller a cash consideration to be determined based on a price to book value ratio using a multiple of 0.4x of the net asset value of BancABC at completion. For more information on the acquisition, see our Cytonn Weekly #19/2021.
Even as the banks continue to expand regionally, we still expect to see more consolidation in the Kenyan banking sector as the weaker banks are merged with the big banks to form a stronger banking system. The COVID-19 pandemic exposed the weak banks in the industry which might need to be acquired by larger banks in order to boost their capital adequacy and liquidity ratios to the required minimum statutory levels.
Below is a summary of the deals in the last 7 years that have either happened, been announced or expected to be concluded:
|
Acquirer |
Bank Acquired |
Book Value at Acquisition (Kshs bn) |
Transaction Stake |
Transaction Value (Kshs bn) |
P/Bv Multiple |
Date |
|
I&M Group |
Orient Bank Limited Uganda |
3.3 |
90.0% |
3.6 |
1.1x |
April-21 |
|
KCB Group |
Banque Populaire du Rwanda, and, ABC Tanzania |
5.3 (Banque Populaire du Rwanda, only. ABC Tanzania financials unknown) |
100.0% |
6.3 |
1.1x |
Acquisition of BPR Rwanda – August 2021, Nov-20* |
|
Co-operative Bank |
Jamii Bora Bank |
3.4 |
90.0% |
1 |
0.3x |
Aug-20 |
|
Commercial International Bank |
Mayfair Bank Limited |
1 |
51.0% |
Undisclosed |
N/D |
May-20* |
|
Access Bank PLC (Nigeria) |
Transnational Bank PLC. |
1.9 |
100.0% |
1.4 |
0.7x |
Feb-20* |
|
Equity Group ** |
Banque Commerciale Du Congo |
8.9 |
66.5% |
10.3 |
1.2x |
Nov-19* |
|
KCB Group |
National Bank of Kenya |
7 |
100.0% |
6.6 |
0.9x |
Sep-19 |
|
CBA Group |
NIC Group |
33.5 |
53%:47% |
23 |
0.7x |
Sep-19 |
|
Oiko Credit |
Credit Bank |
3 |
22.8% |
1 |
1.5x |
Aug-19 |
|
CBA Group** |
Jamii Bora Bank |
3.4 |
100.0% |
1.4 |
0.4x |
Jan-19 |
|
AfricInvest Azure |
Prime Bank |
21.2 |
24.2% |
5.1 |
1.0x |
Jan-18 |
|
KCB Group |
Imperial Bank |
Unknown |
Undisclosed |
Undisclosed |
N/A |
Dec-18 |
|
SBM Bank Kenya |
Chase Bank Ltd |
Unknown |
75.0% |
Undisclosed |
N/A |
Aug-18 |
|
DTBK |
Habib Bank Kenya |
2.4 |
100.0% |
1.8 |
0.8x |
Mar-17 |
|
SBM Holdings |
Fidelity Commercial Bank |
1.8 |
100.0% |
2.8 |
1.6x |
Nov-16 |
|
M Bank |
Oriental Commercial Bank |
1.8 |
51.0% |
1.3 |
1.4x |
Jun-16 |
|
I&M Group |
Giro Commercial Bank |
3 |
100.0% |
5 |
1.7x |
Jun-16 |
|
Mwalimu SACCO |
Equatorial Commercial Bank |
1.2 |
75.0% |
2.6 |
2.3x |
Mar-15 |
|
Centum |
K-Rep Bank |
2.1 |
66.0% |
2.5 |
1.8x |
Jul-14 |
|
GT Bank |
Fina Bank Group |
3.9 |
70.0% |
8.6 |
3.2x |
Nov-13 |
|
Average |
|
|
76.7% |
|
1.3x |
|
|
* Announcement Date ** Deals that were dropped |
||||||
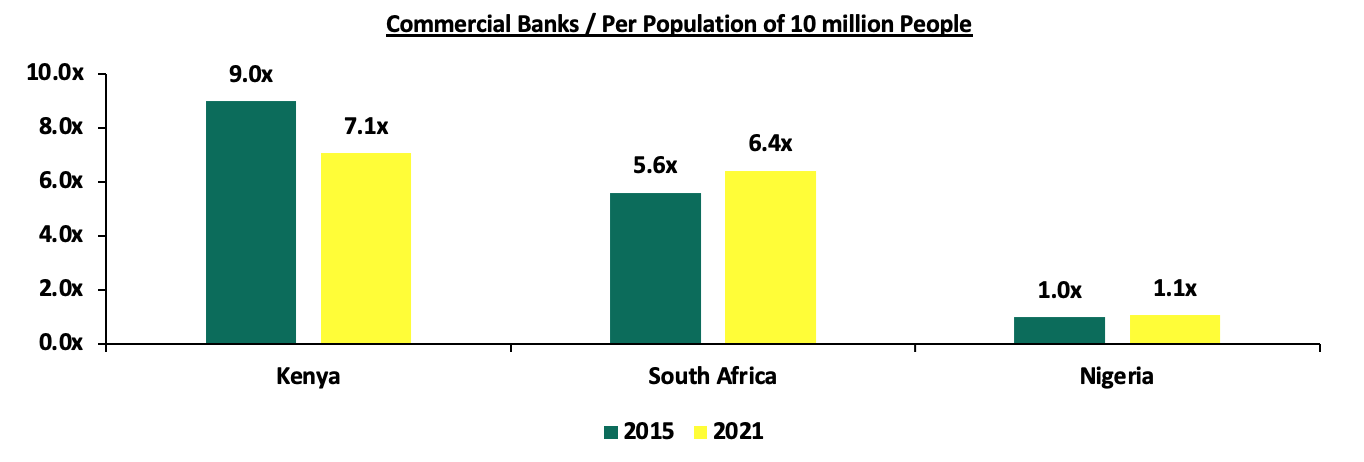
The number of commercial banks in Kenya currently stands at 38, compared to 43 banks 6-years ago. The ratio of the number of banks per 10 million population in Kenya now stands at 7.1x, which is a reduction from 9.0x 6-years ago, demonstrating continued consolidation of the banking sector. However, despite the ratio improving, Kenya still remains overbanked as the number of banks remains relatively high compared to the population. For more on this see our topical.
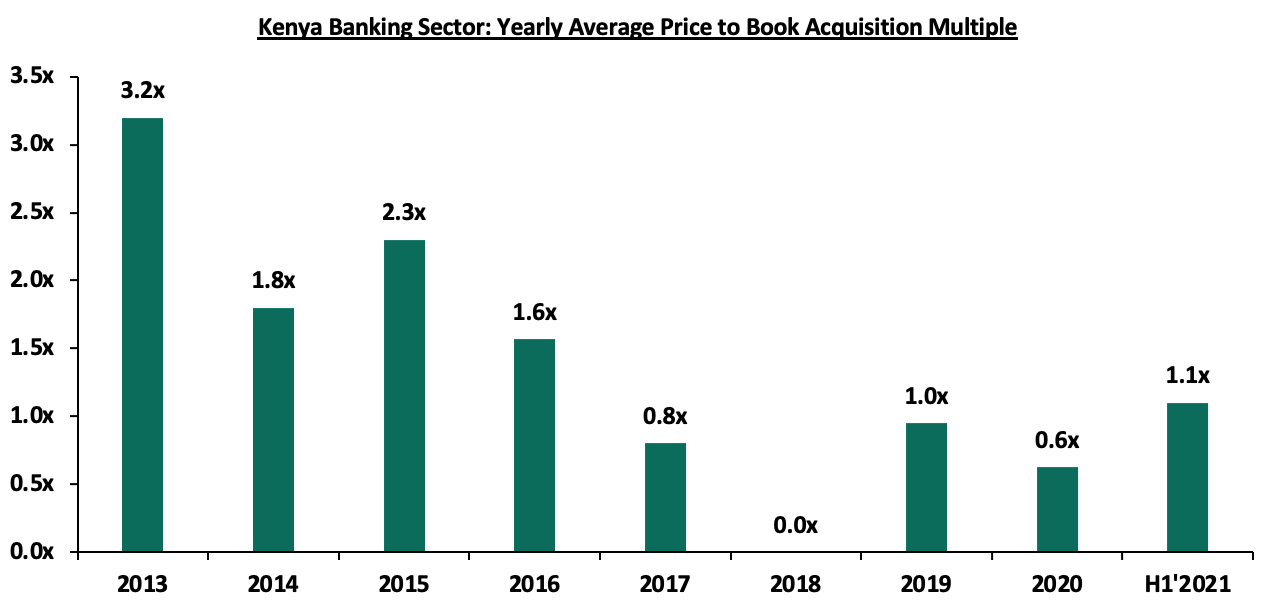
After a consistent decline in the acquisition valuation for banks, we saw an increase in the valuations from the average of 0.6x in 2020 to 1.1x so far in 2021. This however still remains low compared to historical prices paid as highlighted in the chart below;
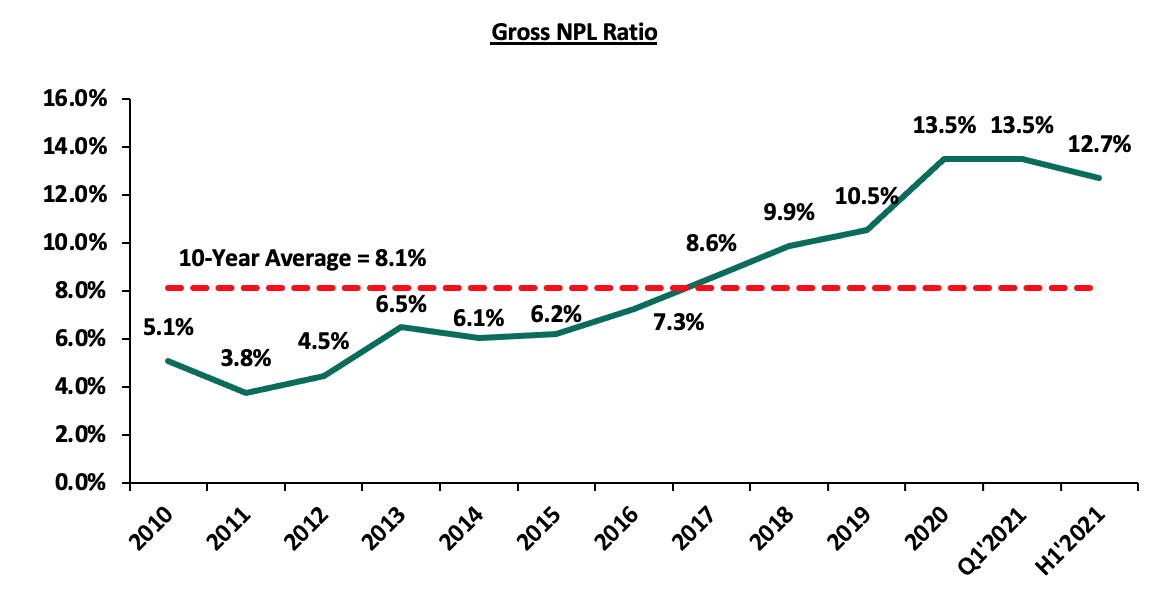
- Asset Quality Deterioration: Asset quality for listed banks deteriorated in H1’2021, with the Gross NPL ratio rising by 1.1% points to 12.7% from 11.6% in H1’2020. The deterioration in asset quality was due to the coronavirus-induced downturn in the economy, which led to an uptick in the non-performing loans. The NPL coverage rose to 64.0% in H1’2021, from 57.8% recorded in H1’2020, in accordance with IFRS 9, where banks are expected to provide both for the incurred and expected credit losses. The significantly higher provisional requirement levels coupled with the increased credit risk led to slower loan growth in H1’2021, which came in at 11.7% compared to a growth of 14.5% in H1’2020. According to the July 2021 MPC Press Release, the NPL ratio for the entire banking sector stood at 14.0% as at June 2021, an improvement from 14.2% in April 2021, signifying an improvement in asset quality for the sector in Q2’2021.
The chart below highlights the asset quality trend:
The table below highlights the asset quality for the listed banking sector:
|
|
H1'2020 NPL Ratio** |
H1'2021 NPL Ratio* |
H1'2020 NPL Coverage** |
H1'2021 NPL Coverage* |
% point change in NPL Ratio |
% point change in NPL Coverage |
|
ABSA Bank Kenya |
8.0% |
7.9% |
63.6% |
70.9% |
(0.1%) |
7.3% |
|
Stanbic Bank |
12.1% |
9.5% |
59.3% |
51.0% |
(2.6%) |
(8.3%) |
|
Diamond Trust Bank |
8.3% |
10.4% |
51.2% |
41.8% |
2.1% |
(9.4%) |
|
I&M Group |
11.1% |
10.4% |
63.1% |
67.2% |
(0.7%) |
4.1% |
|
Equity Group |
11.0% |
11.4% |
48.5% |
63.2% |
0.4% |
14.7% |
|
KCB |
13.8% |
14.4% |
56.9% |
61.6% |
0.6% |
4.7% |
|
Standard Chartered Bank Kenya |
13.9% |
15.1% |
78.2% |
80.1% |
1.2% |
1.9% |
|
Co-operative Bank of Kenya |
11.8% |
15.2% |
54.6% |
63.5% |
3.4% |
8.9% |
|
NCBA Group |
14.5% |
16.7% |
53.2% |
68.0% |
2.2% |
14.8% |
|
HF Group |
26.7% |
22.6% |
43.1% |
65.1% |
(4.1%) |
22.0% |
|
Mkt Weighted Average |
11.6% |
12.7% |
57.8% |
64.0% |
1.1% |
6.2% |
|
*Market cap weighted as at 09/09/2021 |
||||||
|
**Market cap weighted as at 28/08/2020 |
||||||
Key take-outs from the table include;
- Asset quality for the listed banks deteriorated during the period, with the weighted average NPL ratio rising by 1.1% points to a market cap weighted average of 12.7%, from an average of 11.6% for the listed banking sector in H1’2020. Key to note, the listed banks’ NPL ratio of 12.7% is a decline from the 13.5% recorded in Q1’2021, signifying improving credit performance in Q2’2021, but still remains higher than the 10-year average of 8.1%. The deterioration in asset quality y/y was as a result of increased non-performing loans due to the increased credit risk as a consequence of the subdued business environment occasioned COVID-19 pandemic. This could mean provisional requirements remain relatively high compared to similar trading periods before COVID-19,
- NPL Coverage for the listed banks increased to a market cap weighted average of 64.0% in H1’2021, from 57.8% recorded in H1’2020, as the banks increased their provisioning levels due to the difficult economic conditions caused by the pandemic. Banks are expected to continue over-provisioning in 2021, albeit at a slower pace than in 2020,
- Housing Finance (HF) Group recorded the highest improvement in its asset quality, with its NPL ratio declining by 4.1% points to 22.6%, from 26.7% in H1’2020. On the other hand, Co-operative Bank of Kenya recorded the highest increase in its NPL ratio, which increased by 3.4% points to 15.2% from 11.8% recorded in H1’2020, and,
- Notably, Diamond Trust Bank Kenya (DTB-K) reduced their NPL coverage to 41.8% from 51.2% despite the NPL ratio rising to 10.4% from 8.3% in H1’2020. Had DTB-K maintained their NPL coverage at the 51.2% recorded in H1’2020, the bank would have had an additional provisioning of Kshs 2.1 bn, which would have reduced the earnings per share from the reported Kshs 11.3 to Kshs 3.8.
- Capital Raising: In H1’2021, listed banks’ turned to borrowing from international institutions to not only strengthen their capital position but also boost their ability to lend to the perceived riskier Micro Small and Medium Sized Enterprises (MSMEs) segment in order to support the small businesses in the tough operating environment occasioned by the COVID-19 pandemic. The capital raising however slowed down in Q2’2021 after significant activity in Q1’2021. The table below highlights the disclosed loan facilities that banks have secured for capital injection and lending to the MSMEs in H1’2021:
|
Bank |
Amount Borrowed For Onward Lending (Kshs bn) |
Purpose |
|
Equity Bank |
62.9* |
MSME lending |
|
KCB Bank |
16.4 |
MSME lending |
|
Cooperative Bank |
11.0 |
MSME lending and Tier II Capital** |
|
I&M Bank |
5.4 |
MSME lending and Tier II Capital** |
|
Total |
95.7 |
|
|
*Includes a Kshs 2.6 bn grant offered by European Investment Bank (EIB) **Tier II Capital refers to a bank’s supplementary capital which includes senior debt (debt that a company must repay first before going out of business) with a tenure of not less than five years |
||
Section II: Summary of the Performance of the Listed Banking Sector in H1’2021:
The table below highlights the performance of the banking sector, showing the performance using several metrics, and the key take-outs of the performance;
|
Bank |
Core EPS Growth |
Interest Income Growth |
Interest Expense Growth |
Net Interest Income Growth |
Net Interest Margin |
Non-Funded Income Growth |
NFI to Total Operating Income |
Growth in Total Fees & Commissions |
Deposit Growth |
Growth in Government Securities |
Loan to Deposit Ratio |
Loan Growth |
Return on Average Equity |
|
ABSA |
846.0% |
(0.8%) |
(20.4%) |
6.1% |
7.0% |
6.1% |
32.8% |
10.7% |
6.1% |
(9.4%) |
82.9% |
8.4% |
19.3% |
|
KCB |
101.9% |
13.9% |
3.8% |
17.2% |
8.7% |
5.9% |
28.9% |
(2.2%) |
3.7% |
2.2% |
77.2% |
8.4% |
19.2% |
|
Equity |
97.7% |
30.3% |
42.0% |
26.5% |
7.6% |
44.2% |
40.0% |
42.5% |
50.7% |
11.8% |
61.6% |
28.9% |
21.4% |
|
NCBA |
76.9% |
8.7% |
(4.4%) |
19.7% |
0.4% |
6.2% |
44.4% |
(1.0%) |
12.0% |
12.90% |
54.8% |
(3.5%) |
9.1% |
|
SCBK |
37.5% |
(7.5%) |
(24.5%) |
(3.0%) |
6.4% |
13.5% |
35.4% |
19.8% |
8.5% |
(3.2%) |
46.80% |
(3.0%) |
13.70% |
|
Stanbic |
37.2% |
2.1% |
(9.9%) |
9.5% |
4.4% |
10.5% |
44.3% |
3.0% |
(9.4%) |
(2.7%) |
79.9% |
(11.7%) |
11.9% |
|
I&M |
32.2% |
11.6% |
(6.9%) |
28.1% |
5.7% |
(6.4%) |
30.5% |
(6.4%) |
9.6% |
43.30% |
73.9% |
10.8% |
14.5% |
|
DTBK |
20.1% |
5.7% |
5.7% |
5.7% |
5.2% |
5.5% |
25.3% |
(0.9%) |
11.9% |
19.7% |
65.1% |
1.4% |
6.4% |
|
Co-op |
2.3% |
19.0% |
20.9% |
18.3% |
8.6% |
24.3% |
35.4% |
17.8% |
6.0% |
48.7% |
73.9% |
10.7% |
12.7% |
|
HF Group |
(17.4%) |
(15.8%) |
(22.3%) |
(6.8%) |
4.2% |
13.8% |
26.1% |
34.6% |
(3.5%) |
1.9% |
93.3% |
7.5% |
(21.2%) |
|
H1'21 Mkt Weighted Average* |
136.0% |
15.0% |
10.8% |
17.6% |
7.4% |
19.2% |
35.6% |
16.6% |
18.4% |
12.4% |
68.8% |
11.7% |
16.9% |
|
H1'20 Mkt Weighted Average** |
(33.6%) |
10.4% |
10.0% |
10.9% |
7.0% |
(1.1%) |
35.2% |
(3.4%) |
18.5% |
25.9% |
71.5% |
14.5% |
15.4% |
|
*Market cap weighted as at 09/09/2021 **Market cap weighted as at 28/08/2020 |
|||||||||||||
Key takeaways from the table above include:
- For the first half of 2021, core Earnings per Share (EPS) recorded a weighted average growth of 136.0%, compared to a weighted average decline of 33.6% in H1’2020 for the listed banking sector. The performance is however largely skewed by the strong performance from ABSA, KCB and Equity Group of 0%, 101.9% and 97.7%, respectively,
- The Banks have recorded a weighted average deposit growth of 18.4%, a decline from the 18.5% recorded in H1’2020,
- Interest expense grew at a faster pace, by 10.8%, compared to the 10.0% growth in H1’2020 while cost of funds declined, coming in at a weighted average of 2.5% in H1’2021, from 2.9% in H1’2020, owing to the faster growth in average interest-bearing liabilities, an indication that the listed banks were able to mobilize cheaper deposits,
- Average loan growth came in at 11.7%, lower than the 14.5% growth recorded in H1’2020. The loan growth was also outpaced by the 12.4% growth in government securities, an indication that the banks’ are still taking a cautious approach when it comes to lending,
- Interest income grew by 15.0%, compared to a growth of 10.4% recorded in H1’2020. Notably, the weighted average Yield on Interest Earning Assets (YIEA) for the listed banks increased to 9.9%, from the 9.7% recorded in H1’2020 for the listed banking sector, an indication of the increased allocation to higher-yielding government securities by the sector during the period. Consequently, the Net Interest Margin (NIM) now stands at 7.4%, a 0.4% points increase from the 7.0% recorded in H1’2020 for the listed banking sector, and,
- Non-Funded Income grew by 19.2%, compared to the 1.1% decline recorded in H1’2020. This can be attributable to the faster growth in the fees and commission which grew by 16.6% compared to a decline of 3.4% in H1’2020, and points to the diversification of income in the banking sector.
Section III: Outlook of the banking sector:
The banking sector recorded a significant recovery in H1’2021, as evidenced by the increase in profitability, with the Core Earnings Per Share (EPS) growing by 136.0%, despite the tough prevailing operating environment occasioned by the COVID-19 pandemic. The increase in EPS is mainly attributable to the 19.2% growth in Non Funded Income (NFI), compared to a decline of 1.1% recorded in H1’2020, attributable to the expiry of the waiver on fees and commissions on loans in March 2021. Net Interest Income also recorded an increase, rising by 17.6% in H1’2021, compared to an increase of 10.9% in H1’2020. Provisioning levels for most listed banks declined during the period and we expect this reduction in provisioning levels to be a recurrent theme in 2021. However, the banking sector’s Loan Loss Provisions are expected to remain higher than the pre-COVID period and historic average and as such, banks will continue to overprovision during the period, albeit lower than in 2020. Following the expiry of the waiver on fees and commissions on loans and the loan restructuring window having closed in March 2021, we expect the banking sector’s performance to improve in the medium to long term. Based on the current operating environment, we believe the future performance of the banking sector will be shaped by the following key factors:
- Growth in Interest income: With interest income growth at 15.0% in H1’2021 outpacing the 10.4% growth recorded in H1’2020, we believe that interest income growth will remain a key industry driver going forward. The disclosure by banks that most customers that had restructured their loans are now servicing them as normal means that banks are now earning interest on loans restructured at the height of the pandemic, which coupled with increased lending is expected to lead to an increase in the overall interest income. Key to note, some banks are still supporting borrowers after the expiry of the loan restructuring window and this could slow down the recovery of interest income in the medium term,
- Revenue Diversification: In H1’2021, Non-Funded Income recorded a 19.2% weighted average growth, a significant turnaround from the 1.1% decline recorded in H1’2020, attributable to the expiry of the waiver on fees and commissions on loans and advances issued by the CBK in March 2020. The banking sector’s Non-Funded Income to Operating Income also improved, coming in at 35.6% in H1’2021, compared to 35.2% in H1’2020. With Non-Funded Income performance improving, there exists an opportunity for the sector to further increase NFI contribution to revenue going forward. The expiry of the waiver on bank charges on 2nd March 2021 is also expected to spur NFI growth in the medium-long term due to the increased adoption of digital channels, which present an avenue for an increase in fees on transactions. According to Central Bank Annual Report 2019/2020, 67.0% of banking transactions were conducted on mobile phones after the onset of the pandemic, compared to 55.0% of transactions before the pandemic. The increase in mobile-banking transactions therefore provides an opportunity for banks to increase their Non-Funded income going forward,
- Provisioning: Loan Loss Provisions recorded a weighted average decline of 24.8% in H1’2021, compared to a growth of 233.2% in FY’2020 and a growth of 5.5% in Q1’2021, signifying an improvement in business conditions and a reduction of credit risk. However, given that the success of COVID-19 inoculations is reliant on donations from foreign countries, we believe that a cautious approach is still required to manage risk in the banking sector,
- Cost Rationalization: Majority of the banks have been riding on the digital revolution wave to improve their operational efficiency and enhance reliability of outside the branch transactions. Increased adoption of alternative channels of transactions such as mobile, internet, and agency banking has led to increased transactions carried out via alternative channels, reducing branch transactions to handling high-value transactions and other services such as advisory. With the COVID-19 pandemic necessitating contactless transactions, banks reduced front-office operations, thereby cutting the number of staff required and by extension, reducing operating expenses and hence, improving operational efficiency. This has led to banks such as KCB, Equity and ABSA recording 98.0%, 96.1% and 87.0%, respectively of their transactions outside the branch as at H1’2021, and,
- Expansion and Further Consolidation: With consolidation remaining a key theme going forward, the current environment could provide opportunities for bigger banks with an adequate capital base to expand and take advantage of the low valuations in the market to further consolidate and buy out smaller banks. Consolidation will be key for most of the smaller banks that are still struggling during the recovery period, and would also benefit larger banks with the opportunity to improve their asset base. We believe that consolidation could also increase post-COVID as tier one banks resume their expansion strategies both locally and regionally as the economy improves.
Section IV: Brief Summary and Ranking of the Listed Banks:
As per our analysis on the banking sector from a franchise value and a future growth opportunity perspective, we carried out a comprehensive ranking of the listed banks. For the franchise value ranking, we included the earnings and growth metrics as well as the operating metrics shown in the table below in order to carry out a comprehensive review of the banks:
|
Bank |
Loan to Deposit Ratio |
Cost to Income (With LLP) |
Return on Average Capital Employed |
Deposits/ Branch |
Gross NPL Ratio |
NPL Coverage |
Tangible Common Ratio |
Non Funded Income/Revenue |
|
Equity Bank |
61.6% |
54.1% |
21.4% |
2.4 |
11.4% |
63.2% |
12.5% |
40.0% |
|
Absa Bank |
82.9% |
55.5% |
19.3% |
3.1 |
7.9% |
70.9% |
13.0% |
32.8% |
|
KCB Group |
77.2% |
57.2% |
19.2% |
2.2 |
14.4% |
61.6% |
14.5% |
28.9% |
|
I&M Group |
73.9% |
56.3% |
14.5% |
3.1 |
10.4% |
67.2% |
15.9% |
30.8% |
|
SCBK |
46.8% |
51.8% |
13.7% |
7.7 |
15.1% |
80.1% |
14.0% |
35.4% |
|
Coop Bank |
73.9% |
64.1% |
12.7% |
2.3 |
15.2% |
63.5% |
15.2% |
35.4% |
|
Stanbic Bank |
79.9% |
48.9% |
11.9% |
10.4 |
9.5% |
51.2% |
13.8% |
44.3% |
|
NCBA Group |
54.8% |
67.7% |
9.1% |
6.2 |
16.7% |
68.0% |
12.7% |
44.4% |
|
DTBK |
65.1% |
62.9% |
6.4% |
2.3 |
10.4% |
41.8% |
15.1% |
25.3% |
|
HF Group |
93.3% |
125.5% |
(21.2%) |
1.7 |
22.63% |
65.1% |
14.5% |
26.1% |
|
Weighted Average H1'2021 |
68.8% |
57.1% |
16.9% |
3.5 |
12.7% |
64.0% |
13.8% |
35.6% |
The overall ranking was based on a weighted average ranking of Franchise value (accounting for 60.0%) and intrinsic value (accounting for 40.0%). The Intrinsic Valuation is computed through a combination of valuation techniques, with a weighting of 40.0% on Discounted Cash-flow Methods, 35.0% on Residual Income and 25.0% on Relative Valuation, while the Franchise ranking is based on banks operating metrics, meant to assess efficiency, asset quality, diversification, and profitability, among other metrics. The overall H1’2021 ranking is as shown in the table below:
|
Bank |
Franchise Value Rank |
Intrinsic Value Rank |
Weighted Rank |
Q1'2021 |
H1'2021 |
|
I&M Group |
2 |
1 |
1.4 |
1 |
1 |
|
ABSA |
1 |
2 |
1.6 |
5 |
2 |
|
KCB Group Plc |
3 |
3 |
3.0 |
2 |
3 |
|
Equity Group Holdings Ltd |
5 |
5 |
5.0 |
3 |
4 |
|
NCBA Group Plc |
8 |
4 |
5.6 |
5 |
5 |
|
SCBK |
6 |
6 |
6.0 |
9 |
6 |
|
Stanbic Bank/Holdings |
4 |
8 |
6.4 |
4 |
7 |
|
Co-operative Bank of Kenya Ltd |
7 |
7 |
7.0 |
8 |
8 |
|
DTBK |
9 |
9 |
9.0 |
7 |
9 |
|
HF Group Plc |
10 |
10 |
10.0 |
10 |
10 |
Major Changes from the Q1’2020 Ranking are:
- ABSA Bank recorded an improvement in the overall ranking, coming in at position 2 from position 5 in Q1’2021 attributable to the bank ‘s Gross NPL ratio of 7.9%, which was the lowest among the listed banks, leading to an increase in the bank’s franchise value score, coupled with an improvement in the bank’s Cost to Income ratio, which recorded a 5.8% points decline to 55.5% from 61.3% recorded in Q1’2021,
- Standard Chartered Bank’s rank improved to position 6 from position 9 in Q1’2021, attributable to a 0.2% decline in its Cost to Income ratio, which contributed to an increase in the bank’s franchise value score, coupled with the bank’s NPL coverage of 80.1%, which was the highest in the listed banking sector, and,
- Stanbic Bank’s rank declined to Position 7 from Position 4 in Q1’2021, attributable to a 1.7% points reduction in the bank’s Net Interest Margin to 4.4% from 6.1% in Q1’2021, coupled with a 12.7% points decline in the bank’s NPL coverage to 51.2%, from 63.9% in Q1’2020.
For more information, see our Cytonn H1’2021 Listed Banking Sector Review
Disclaimer: The views expressed in this publication are those of the writers where particulars are not warranted. This publication, which is in compliance with Section 2 of the Capital Markets Authority Act Cap 485A, is meant for general information only and is not a warranty, representation, advice or solicitation of any nature. Readers are advised in all circumstances to seek the advice of a registered investment advisor.


