In 2022, we published the Nairobi Metropolitan Area Commercial Office Report 2022 themed ‘Changing Working Patterns Driving the Market’, in which we highlighted the performance of the sector in 2021, as well as giving insights on the outlook and areas best fit for investment opportunities. According to the report, the sector witnessed improved performance, with the average rental yields coming in at 7.3% in 2021, 0.3% points higher than the 7.0% recorded in 2020, attributed to continued COVID-19 pandemic recovery, an improved business environment and expansion in activities by various firms. The average occupancy rates slightly reclined by 0.1% points to 77.6% in 2021, from 77.7% recorded in 2020, this is as some firms still embraced a work from home policy. Asking rents and prices stabilized to an average of Kshs 94 and Kshs 12,108 per SQFT respectively in 2021, from Kshs 93 and Kshs 12,280 per SQFT, respectively, recorded in 2020. In addition, there was an oversupply of 6.7 mn SQFT in office spaces in the market, which continued to subdue the sector’s optimum performance.
This week, we update our previous research with the Commercial Office Report 2023 themed ‘Persisting Tenant’s Market’, in order to determine the market’s performance and analyse the ongoing trends, by looking at the following:
- Overview of the Commercial Office Sector,
- Commercial Office Supply in the Nairobi Metropolitan Area,
- Commercial Office Performance, by Location and by Grades, and,
- Office Market Outlook and the Investment Opportunity in the Sector.
Section I: Overview of the Commercial Office Sector
In 2022, the commercial office market in the Nairobi Metropolitan Area (NMA) experienced notable growth in overall sector activities compared to 2021, driven by growth in demand for office space and further expansion activities by developers. In addition, the desire for convenience allowed the co-working office theme to gain more traction, with entry of more developments offering serviced offices. Some of the factors that have been driving the increased performance and activities in the market include;
- Continued business reopening: 2022 was characterized by increased business operations following continued post COVID-19 recovery which drove demand for commercial office spaces. This resulted in a slight increase in overall occupancy rates for the sector and an improvement in rental yields, prompting the construction of new office buildings and the renovation of existing ones to meet the rising demand,
- Serviced Offices/ Co-Working Spaces: Serviced offices and co-working spaces are gaining popularity in Kenya due to their convenience and flexibility, making them attractive to both tenants and investors. These types of spaces offer an affordable and flexible option for entrepreneurs and small businesses that do not want to commit to long-term leases,
- Growing Demand for Grade A and Green Spaces: Growing investor knowledge and the entry of multinational corporations (MNCs) into Kenya have led to a growing demand for high quality, Grade A office space and attention to sustainability in the office market. This is because many MNCs favour developments that provide well-furnished and equipped work environments, which integrate Environmental, Social, and Governance (ESG) features such as green technology,
- Nairobi’s Recognized Position as a Regional Hub: Nairobi remains an attractive investment location within the region for MNCs. For instance, in February 2023, Commonwealth Enterprise and Investment Council (CWEIC), an international business organization, opened its regional office in Nairobi, Kenya, to serve as East Africa’s business hub. This indicates the potential for Nairobi's commercial office sector to attract investments compared to other cities in the region, thereby bolstering performance of the sector, and,
- Positive National Demographics: Kenya has a relatively high urbanization at 3.7%, 2.1% points higher than the global average of 1.6% according to the World Bank as of 2021. This rapid urbanization is driving demand for office spaces as more people move into urban areas, seeking job opportunities and better living conditions. The trend is expected to continue as the government continues to implement policies that promote urbanization and investment in infrastructure.
Conversely, the sector continues to face setbacks such as;
- Oversupply of Office Space: The supply of office space in Nairobi Metropolitan Area exceeds the current demand, resulting in an oversupply of 5.8 mn SQFT in 2022. This oversupply has led to prolonged vacancy rates, prompting developers to halt construction plans for new developments until the excess office space in the market is absorbed,
- Remote/ Hybrid Working Model: The adoption of remote or hybrid working models by some companies has negatively impacted the overall occupancy rates of office spaces and the returns for landlords. However, it is worth noting that a shift from full remote working to a hybrid model by some companies will improve the sector’s office occupancy rates, and,
- Financial Constraints: Developers face financial constraints due to difficulties accessing credit loans as banks have tightened their loan lending terms and request more collateral due to increasing default rates, evidenced by gross Non-Performing Loans (NPLs) in the Real Estate sector increasing by 9.2% to Kshs 75.6 bn in Q3’2022 from Kshs 69.2 bn recorded in Q3’2021. This is further aggravated by the rising costs of construction costs, averaging Kshs 5,210 in 2022, a 5.0% increase from Kshs 4,960 recorded in 2021, attributable to price increase of key construction materials such as cement, steel, paint, aluminium and PVC.
Section II: Commercial Office Supply in the Nairobi Metropolitan Area
The year 2022 saw considerable increase in office supply, with the addition of 6 new office developments that injected up to 0.6 mn SQFT of space into the commercial office market. The developments included; The Piano, Principal Place and The Rock in Westlands, Trade and development Bank (TDB) Tower in Kilimani, The Cube in Riverside, and Karen Green in Lang’ata. On the other hand, 0.3 mn SQFT of space is in the pipeline slated to enter the market in 2023, which includes; Curzon in Lavington and CCI Global’s Headquarters located in Tatu City. The table below shows some of the notable office completions during the review period as well as incoming spaces:
|
Cytonn Report: Nairobi Metropolitan Area Commercial Office Space Supply |
||||||
|
Major Commercial Office Completions in 2022 |
Major Incoming Commercial Office Space Supply in 2023 |
|||||
|
# |
Development |
Location |
Size (SQFT) |
Development |
Location |
Size (SQFT) |
|
1 |
The Piano |
Westlands |
136,167 |
CCI Global HQ |
Tatu City |
233,168 |
|
2 |
Principal Place |
Westlands |
119,000 |
Curzon |
Lavington |
60,000 |
|
3 |
The Rock |
Westlands |
100,000 |
|
|
|
|
4 |
TDB Tower |
Kilimani |
90,000 |
|
|
|
|
5 |
The Cube |
Riverside |
77,876 |
|
|
|
|
6 |
Karen Green |
Lang’ata |
67,700 |
|
|
|
|
Total |
|
|
590,743 |
|
|
293,168 |
Source: Cytonn Research, Knight Frank
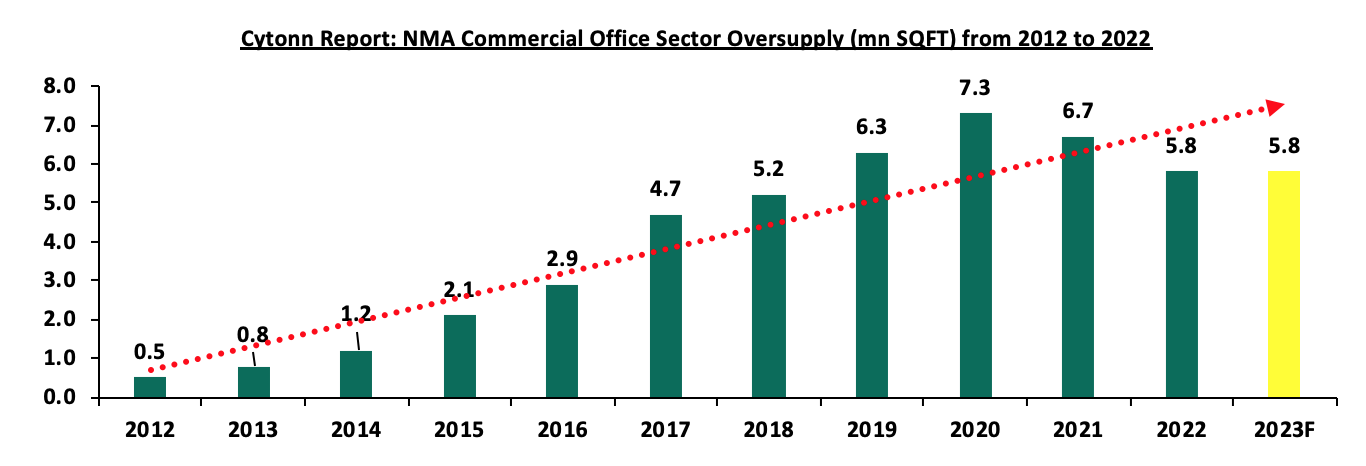
The NMA commercial office sector recorded an office space oversupply of 5.8 mn SQFT in 2022, a 13.4% decline from the 6.7 mn SQFT realized in 2021. This was attributed to increased demand of physical office spaces as most businesses reverted back to full office operations while other organisations continued to adopt the hybrid work policy from the work from home policy, as well as continued economic recovery and a peaceful post-electioneering period. This saw the average office vacancy rate come in at 20.6% in 2022, a decline of 1.5% points from 22.1% recorded in 2021, as the demand for office space continued the gradual recovery from the impacts of COVID-19 pandemic in 2020. During 2022, the growth in demand for office space prompted the new developments to be absorbed faster, even as 0.6 mn SQFT of office space was released into the market, 20.0% higher than the 0.5 mn SQFT supplied in 2021. This is anticipated to further cushion the sector as less office developments are expected to be completed in 2023 compared to 2022, further reducing the oversupply of office space in the market. The table below summarizes the commercial office space supply over time;
|
Cytonn Report: Nairobi Metropolitan Area Office Space Analysis |
||||||||||||
|
Year |
2012 |
2013 |
2014 |
2015 |
2016 |
2017 |
2018 |
2019 |
2020 |
2021 |
2022 |
2023 F |
|
Stock (Mn SQFT) |
7.7 |
9.7 |
15.4 |
22.9 |
28.9 |
31.8 |
35.5 |
36.3 |
36.4 |
36.8 |
37.4 |
37.1 |
|
Completions (Mn SQFT) |
1.2 |
2.1 |
5.9 |
7.8 |
6.5 |
3.5 |
4.3 |
1.5 |
0.8 |
0.5 |
0.6 |
0.3 |
|
Vacancy Rate (%) |
9.0% |
10.0% |
10.0% |
11.0% |
12.0% |
16.8% |
16.7% |
19.5% |
22.3% |
22.1% |
20.6% |
19.7% |
|
Vacant Stock (Mn SQFT) |
0.7 |
1.0 |
1.5 |
2.5 |
3.5 |
5.3 |
5.9 |
7.1 |
8.1 |
8.1 |
7.7 |
7.3 |
|
Occupied Stock (Mn SQFT) |
7.1 |
8.8 |
13.9 |
20.3 |
25.4 |
26.5 |
29.6 |
29.2 |
28.3 |
28.7 |
29.7 |
29.8 |
|
Net Absorption |
1.0 |
1.7 |
5.1 |
6.5 |
5.1 |
1.0 |
3.1 |
(0.4) |
(1.0) |
0.4 |
1.0 |
1.1 |
|
Demand |
1.1 |
1.9 |
5.3 |
6.8 |
5.6 |
1.6 |
3.7 |
0.4 |
(0.2) |
1.2 |
1.8 |
1.9 |
|
Available Supply, AS(T) |
1.7 |
2.6 |
6.5 |
8.8 |
8.4 |
6.3 |
9.0 |
6.7 |
7.1 |
7.9 |
7.6 |
7.7 |
|
Gap, GAP(T) |
(0.5) |
(0.8) |
(1.2) |
(2.1) |
(2.9) |
(4.7) |
(5.2) |
(6.3) |
(7.3) |
(6.7) |
(5.8) |
(5.8) |
Source: Cytonn Research/ Building Plan Approvals Data from the Nairobi City County
The chart below highlights the trend for oversupply in the Nairobi Metropolitan Area (NMA) Commercial Office sector from 2012 – 2022;
Source: Cytonn Research
Section III: Commercial Office Performance, by Location and by Grades
The Commercial Office sector realized a 0.3% points increase in average rental yields in 2022 to 7.6%, from 7.3% recorded in 2021 attributable to increased occupancy and rental rates. Average asking rents per SQFT in the Nairobi Metropolitan Area (NMA) increased by 2.1% to Kshs 96 per SQFT from Kshs 94 per SQFT in 2021. Additionally, occupancy rates increased by 1.8% points to 79.4%, which is the highest recorded since the start of the COVID-19 pandemic in 2020, surpassing 77.6% achieved in 2021. The improved performance in the Commercial Office space sector can be attributed to several factors, including: i) slow but steady rise in demand for physical spaces as more firms resumed full operations, ii) increased supply of high-quality Grade A office spaces, such as Karen Green and Global Trade Centre (GTC) Office, which attract premium rents, iii) the adoption of expansion strategies by companies such as Call Centre International (CCI) Group boosting occupancy rates, and iv) a stabilizing and improved business environment following the resumption of economic activities after the COVID-19 period and the peaceful conclusion of the August 2022 general elections. The table below summarizes the performance of the commercial office theme over time:
|
(All Values in Kshs Unless Stated Otherwise) |
|||||||||
|
Cytonn Report: Commercial Office Performance Over Time |
|||||||||
|
Year |
2015 |
2016 |
2017 |
2018 |
2019 |
2020 |
2021 |
2022 |
y/y ∆ 2022 |
|
Occupancy (%) |
89.0% |
88.0% |
82.6% |
83.8% |
80.3% |
77.7% |
77.6% |
79.4% |
1.8% |
|
Asking Rents (Kshs/SQFT) |
97 |
97 |
101 |
101 |
96 |
93 |
94 |
96 |
2.1% |
|
Average Prices (Kshs/SQFT) |
12,776 |
12,031 |
12,649 |
12,407 |
12,638 |
12,280 |
12,106 |
12,223 |
1.0% |
|
Node Average Rental Yields (%) |
8.1% |
8.5% |
7.9% |
8.3% |
7.5% |
7.0% |
7.3% |
7.6% |
0.3% |
Source: Cytonn Research
- Commercial Office Performance by Nodes
For the purposes of submarket analysis, we categorized the primary office locations within the Nairobi Metropolitan Area into 9 major nodes; i) Nairobi CBD, ii) Westlands, covering environs including Riverside, iii) Parklands, iv) Mombasa Road, v) Thika Road, vi) Upperhill, vii) Karen, viii) Gigiri, and, ix) Kilimani, which includes offices in Kilimani, Kileleshwa and Lavington.
The table below shows the Nairobi Metropolitan Area (NMA) sub-market performance;
|
(All values in Kshs unless stated otherwise) |
|
|
|
||||||||
|
Cytonn Report: Nairobi Metropolitan Area Commercial Office Market Performance FY’2022 |
|||||||||||
|
Area |
Price/SQFT FY 2021 |
Rent/SQFT FY 2021 |
Occupancy FY 2021(%) |
Rental Yields FY 2021(%) |
Price Kshs/ SQFT FY 2022 |
Rent Kshs/ SQFT FY 2022 |
Occupancy FY 2022(%) |
Rental Yield FY 2022(%) |
∆ in Rent
|
∆ in Occup ancy
|
∆ in Rental Yields |
|
Gigiri |
13,500 |
119 |
81.3% |
8.6% |
13,500 |
118 |
81.6% |
8.7% |
(0.8%) |
0.3% |
0.1% |
|
Westlands |
11,972 |
104 |
75.5% |
8.1% |
12,032 |
108 |
76.4% |
8.3% |
3.8% |
0.9% |
0.2% |
|
Karen |
13,325 |
106 |
83.0% |
7.7% |
13,431 |
111 |
82.9% |
8.3% |
4.7% |
(0.1%) |
0.6% |
|
Kilimani |
12,364 |
91 |
79.8% |
7.1% |
12,260 |
92 |
84.1% |
7.7% |
1.1% |
4.3% |
0.6% |
|
Upperhill |
11,336 |
91 |
80.1% |
7.6% |
11,662 |
91 |
81.5% |
7.7% |
0.0% |
1.4% |
0.1% |
|
Parklands |
11,787 |
82 |
82.8% |
6.8% |
11,971 |
83 |
85.2% |
7.3% |
1.2% |
2.4% |
0.5% |
|
Nairobi CBD |
12,409 |
94 |
78.0% |
7.0% |
12,586 |
96 |
76.5% |
7.1% |
2.1% |
(1.5%) |
0.1% |
|
Thika Road |
12,571 |
79 |
76.3% |
5.7% |
12,571 |
79 |
80.1% |
6.0% |
0.0% |
3.8% |
0.3% |
|
Mombasa Road |
11,250 |
73 |
64.2% |
5.1% |
11,325 |
71 |
66.9% |
5.1% |
(2.7%) |
2.7% |
0.0% |
|
Average |
12,106 |
94 |
77.6% |
7.3% |
12,223 |
96 |
79.4% |
7.6% |
2.1% |
1.8% |
0.3% |
Source: Cytonn Research
Key take-outs from the table above include;
- Gigiri was the best performing node in FY’2022 realizing an average rental yield of 8.7%, 1.1% points above the market average of 7.6%. Westlands and Karen were the second-best performing nodes, both registering average rental yields of 8.3%. The main factors contributing to the high demand for premium office spaces and attractive investment opportunities in these areas include: i) significant concentration of top-quality office buildings commanding premium rental rates and yields, ii) the availability of sufficient infrastructure and amenities that enhance the value of investments, and iii) the presence of multinational corporations, international organizations, and embassies in these locations driving up demand for quality office spaces, and,
- Conversely, Mombasa Road was the least performing node in FY’2022 with an average rental yield of 5.1%, 2.5% points lower than the market average of 7.6% attributed to; i) the predominance of lower quality office buildings that command lower average rental rates at Kshs 73 per SQFT, ii) its reputation as an industrial zone, making it less appealing to office-based businesses, and, iii) stiff competition from other sub-markets.
- Commercial Office Performance by Class/Grade:
Commercial office buildings are categorized into three main classes based on the quality and sizes of office spaces as follows:
- Grade A: These are high quality office buildings characterized by their adequate amenities, facilities, and finishes. They therefore fetch higher rental rates and yields compared to other office types. Also these office building sizes range from 100,001 - 300,000 SQFT,
- Grade B: These office buildings have their sizes ranging between 50,000 to 100,000 SQFT. They have good amenities and services, however not as good as Grade A offices, hence charge moderate rental rates, and,
- Grade C: These buildings are usually old, hence their lack of adequate services and facilities. Usually, they charge rents below the average market rate.
According to our office grade distribution analysis, Grade B offices constituted the majority of office spaces in the Nairobi Metropolitan Area in 2022, accounting for a current market share of 54.1%. However, notwithstanding, this marks a slight drop of 1.9% points from the 56.0% recorded in 2021, which can be attributed to the rise in the completion of Grade A offices, such as Principal Place, The Piano and The Cube in Westlands. Notably, the supply of Grade A office spaces increased by 3.7% to 28.2% from 24.7%.
In the nodal analysis, Gigiri, Karen, and Upperhill had the highest proportion of Grade A offices constituting 60.0%, 53.8% and 34.8% of their total office inventory. In contrast, Kilimani had the highest percentage of Grade B offices at 76.9%. However, this was a 4.9% points decline from 81.8% recorded in 2021. This was attributable to a 6.3% points increase in the overall supply of Grade A offices in Kilimani, brought about by completions such as the TDB Towers which injected an additional 90,000 SQFT of Grade A office space into the Kilimani market. For Grade C offices, Mombasa Road accounted for a majority of the office spaces with a current market share of 50.0%, remaining relatively unchanged from 2021. In terms of concentration, Mombasa Road had the highest mix of office types, having recorded 30.0%, 20.0%, and 50.0% of Grade A, Grade B, and Grade C office spaces respectively. The distribution of various office classes/grades is as summarized in the table below:
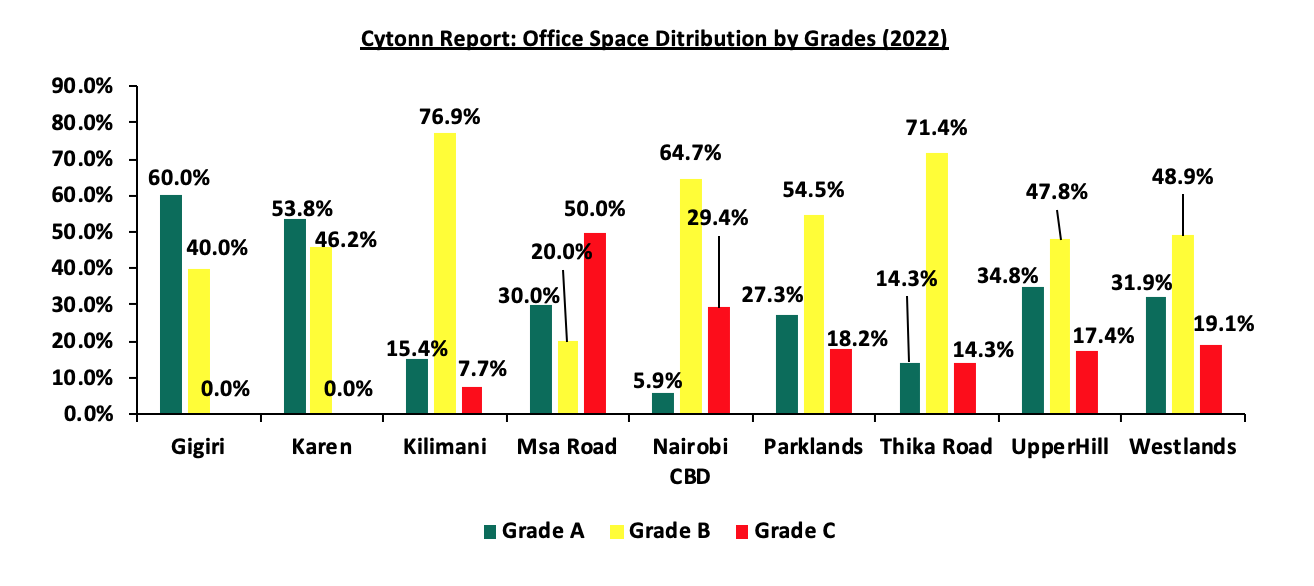
Source: Cytonn Research
In terms of performance;
- Grade B office spaces realized the highest rental yields at 7.8%. This was attributable to their increased preference by tenants evidenced by a 3.4% increase in occupancy rates, which was mainly as a result of their relatively affordable rental rates compared to Grade A offices and better technical services in comparison to Grade C office spaces,
- Grade A offices recorded the highest Year-on-Year (y/y) increase in rental rates by 5.1% in 2022 to Kshs 104 per SQFT from Kshs 99 per SQFT realized in 2021 attributed to their high quality spaces fetching higher rents, and increased demand by multinational firms and organizations, and,
- Grade C offices realized a slight increase in average rental yields by 0.1% points to 6.7% from 6.6% attributable to a 1.2% increase in average rental rates to Kshs 83 per SQFT from Kshs 82 per SQFT recorded in 2021. However, the increase was countered by a 1.1% points decline in average occupancy rates which is attributable to reduced demand by tenants, opting for Grade B offices which offer high quality office space with ample amenities such as parking.
The performance according to grades/class is as summarized in the table below:
|
(All Values in Kshs Unless Stated Otherwise) |
|||||||||||
|
Cytonn Report: Commercial Office Performance Based On Grades 2022 |
|||||||||||
|
Office Grade |
Price 2021 Kshs/SQFT |
Rent 2021 Kshs/SQFT |
Occupancy 2021 |
Rental Yield 2021 |
Price 2022 Kshs/SQFT |
Rent 2022 Kshs/SQFT |
Occupancy 2022 |
Rental Yield 2022 |
∆ Rent y/y |
∆ Occupancy y/y |
∆ Rental Yield y/y |
|
Grade A |
12,674 |
99 |
79.4% |
7.5% |
13,040 |
104 |
79.0% |
7.7% |
5.1% |
(0.4%) |
0.2% |
|
Grade B |
12,340 |
97 |
78.2% |
7.5% |
12,292 |
97 |
81.6% |
7.8% |
(0.0%) |
3.4% |
0.3% |
|
Grade C |
10,839 |
82 |
74.3% |
6.6% |
10,867 |
83 |
73.2% |
6.7% |
1.2% |
(1.1%) |
0.1% |
Source: Cytonn Research
- Commercial Office Performance by Class and Node:
In 2022, Grade A offices in Gigiri and Karen realized the most substantial average rental yields coming in at 8.4% and 8.3% respectively. This was attributable to; i) their strategic locations attracting high-end clientele which has enabled charging premium rates, ii) adequate amenities and infrastructure servicing the areas thus enhancing accessibility, and, iii) serene environment providing great locations for offices away from the bustle of the city centre. Strikingly, despite Grade A offices charging higher rental rates at 104 per SQFT compared to average rental rates of Grade B offices which stood at Kshs 97 per SQFT, Grade B offices in Gigiri had higher yields at 9.2%, compared to 8.4% recorded by Grade A offices. This was attributed to lower average selling prices chargeable per SQM for Grade B offices in Gigiri which came in at Kshs 13,000, compared to Kshs 14,000 per SQM for Grade A offices, since the yield is a factor of average rental rates, occupancies and selling price. As such, higher selling prices for Grade A offices resulted in slightly lower yields in comparison to Grade B offices even though all other factors for Grade A offices were slightly higher than Grade B offices. On the other hand, Grade B offices in Gigiri and Westlands had the highest rental yields of 9.2% and 8.4% respectively. Similarly, Grade C offices in Westlands and Nairobi CBD had the best returns with average rental yields coming in at 8.4% and 7.6%, respectively. The class performance by node is as summarized in the table below with the best performing areas of each grade highlighted in yellow;
|
Cytonn Report: Commercial Office Performance in 2022 by Nodes and Grades |
||||||
|
|
Grade A |
Grade B |
Grade C |
|||
|
Location |
Average of Occupancy (%) |
Average of Rental Yield |
Average of Occupancy (%) |
Average of Rental Yield |
Average of Occupancy (%) |
Average of Rental Yield |
|
Gigiri |
82.0% |
8.4% |
81.0% |
9.2% |
- |
- |
|
Westlands |
74.7% |
7.9% |
77.0% |
8.4% |
77.2% |
8.4% |
|
Karen |
83.1% |
8.3% |
82.7% |
8.2% |
- |
- |
|
Parklands |
83.2% |
7.7% |
83.0% |
8.0% |
72.3% |
6.7% |
|
Kilimani |
73.5% |
6.7% |
86.9% |
8.0% |
70.0% |
5.8% |
|
Nairobi CBD |
- |
- |
85.1% |
7.1% |
85.6% |
7.6% |
|
UpperHill |
79.1% |
7.6% |
80.5% |
7.1% |
65.1% |
6.0% |
|
Msa Road |
73.0% |
5.3% |
67.5% |
6.5% |
63.0% |
4.5% |
|
Thika Road |
90.0% |
7.4% |
80.0% |
5.9% |
71.0% |
5.2% |
Source: Cytonn Research
- Serviced Offices
In 2022, serviced offices realized a 2.0% Year-on-Year (y/y) growth in rental revenues, with average rental rates increasing to Kshs 190 per SQFT, from Kshs 183 per SQFT recorded in 2021. In comparison, unserviced offices revenues increased by 1.1%, with average rental rates increasing to Kshs 94 per SQFT in 2022, from Kshs 93 per SQFT realized in 2021. Notably, serviced offices in Westlands and Karen recorded the highest rent appreciations of 3.8% and 3.5%, respectively, significantly higher than the market average of 2.0%. The improvement in performance in these locations is due to; i) the presence of quality infrastructure enhancing accessibility, ii) higher demand for serviced offices supported by the presence of a high-end clientele and international firms with changing preferences, diversified themes and articulate designs which demand world-class standards, iii) high quality facilities attracting prime rents, and, iv) serene office locations which appeal to clients moving away from the city hustle. The table below gives a comparison of the performance of the NMA serviced office sector;
|
(All values in Kshs Unless Stated Otherwise) |
||||||
|
Cytonn Report: Nairobi Metropolitan Area Serviced Office Performance |
||||||
|
Location |
Revenue Per SQFT 2021 |
Revenue Per SQFT 2022 |
Serviced Offices Revenue growth (%) |
Unserviced Offices Revenue growth (%) |
||
|
Serviced Offices |
Un-serviced Offices |
Serviced Offices |
Un-serviced Offices |
|||
|
Westlands |
212 |
104 |
220 |
108 |
3.8% |
3.5% |
|
Karen |
192 |
106 |
199 |
111 |
3.5% |
4.3% |
|
Parklands |
169 |
91 |
171 |
91 |
1.3% |
(0.2%) |
|
Gigiri |
- |
119 |
210 |
118 |
- |
(0.8%) |
|
Upperhill |
235 |
94 |
243 |
97 |
3.1% |
3.1% |
|
Kilimani |
194 |
91 |
199 |
92 |
2.4% |
1.1% |
|
Nairobi CBD |
164 |
82 |
168 |
83 |
2.1% |
1.7% |
|
Msa Rd |
- |
73 |
- |
71 |
- |
(2.4%) |
|
Thika Rd |
112 |
79 |
110 |
79 |
(2.3%) |
(0.5%) |
|
Average |
183 |
93 |
190 |
94 |
2.0% |
1.1% |
Source: Cytonn Research
Notably, in 2022, there was a growing trend in the establishment of niche centric office spaces in Kenya, most especially co-working spaces. In support of this, Nairobi Garage, a leading provider of flexible working spaces in Nairobi opened a 12,000 SQFT outlet in the Central Business District (CBD) along Mama Ngina street. This move by the co-working space provider increased its number of outlets to five, with locations in Westlands, Spring Valley, Kilimani and Karen. Furthermore, Kofisi Africa, a leading pan African provider of flexible and bespoke workplaces, opened a new branch dubbed ‘Kofisi Square’ located in Riverside, Nairobi. The new 50,000 SQFT outlet is its sixth branch in Nairobi, with branches in Karen, Riverside and Westlands. In addition to the Nairobi locations, Kofisi Africa also has branches in Nigeria, Ghana, Dar-es-Salaam, Johannesburg and Cairo. We expect to see an increase in the development of more co-working spaces, as the sector currently only constitutes less than 3.0% of the total available office stock. The table below highlights major co-working office spaces released into the market in 2022;
|
Cytonn Report: Notable Co-working Space Office Developments delivered in 2022 |
||||
|
# |
Space provider |
Office Name |
Location |
Size (SQFT) |
|
1 |
Nairobi Garage |
Nairobi Garage CBD |
CBD, Nairobi |
12,000 |
|
2 |
Kofisi Africa |
Kofisi Square |
Riverside |
50,000 |
|
|
Total |
|
|
62,000 |
Source: Cytonn Research, Knight Frank
Section IV: Office Market Outlook and the Investment Opportunity in the Sector
Based on the office market supply, demand, performance, and investor returns, we have a NEUTRAL outlook for the commercial office sector theme in Nairobi Metropolitan Area (NMA) mainly due to the 5.8 mn SQFT oversupply of space with reduction in incoming new supply at 0.3 mn SQFT. However, with most firms and business fully embarking to working from the office amidst the improved economic environment in post COVID-19 and post-electioneering periods, we expect that this will cushion the performance of the sector. The table below summarizes our outlook on the sector based on the various key driving factors.
|
Cytonn Report: Nairobi Metropolitan Area (NMA) Commercial Office Outlook |
||||
|
Measure |
2021 Sentiment |
2022 Sentiment and 2023 Outlook |
2022 Review |
2023 Outlook |
|
Supply |
The sector recorded an oversupply of 6.7 mn SQFT of office space in 2021, an 8.3% decrease from the 7.3 mn SQFT realized in 2020 in NMA. This was due to increased demand of physical office spaces as some firms resumed full operations and others adjusted to hybrid model of working both in physical offices and at home. The incoming supply in 2021 came at 0.5 mn SQFT 37.5% lower than the 0.8 mn SQFT recorded in 2020. |
The oversupply of commercial office space declined by 13.4% to approximately 5.8 mn SQFT in 2022 from approximately 6.7 mn SQFT in 2021, attributed to increased demand for office spaces which in turn increased the occupancy rates by 1.8% points to 79.4% in 2022 from 77.6% in 2021 at the back of continuous recovery of economy in post-COVID-19 period. This is as most corporate organizations and businesses reverted to full operations and use of physical spaces. The incoming supply in 2022 came at 0.6 mn SQFT 20.0% higher than the 0.5 mn SQFT recorded in 2021. We expect the office space oversupply to remain unchanged at approximately 5.8 mn SQFT in 2023, attributable to an expected reduction in vacancy rates by 0.9% to 19.7% from 20.6% in 2022, and increase in occupied stock by 0.3% to 29.8 mn SQFT from 29.7 mn SQFT in 2022 even though there will be an expected new supply of 0.3 mn SQFT in the market. |
Neutral |
Neutral |
|
Demand |
There was an increased demand for office spaces, evidenced by the 0.1% increase in the average occupancy rates which came in at 77.6% in 2021, from the 77.7% recorded in 2020. This was mainly attributed to full resumptions of operations of corporate organisations and businesses after the lifting of COVID-19 containment measures. Additionally, the absorption of office spaces increased to 0.4 mn SQFT in 2021 from (1.0) mn SQFT recorded in 2020 |
There was an increased demand for office spaces in the NMA, evidenced by the 1.8% increase in the average occupancy rates which came in at 79.4% in 2022 from 77.6% recorded in 2021. This was mainly attributed to as a result of a slow but rising demand for physical space on the back of various firms resuming full operations, coupled with the expansion strategy by various firms such as Call Centre International (CCI) Group and rising trend in serviced office spaces spearheaded by firms like Nairobi Garage, Kofisi, and Regus. In addition to this, the absorption of office spaces increased by 150.0% to 1.0 mn SQFT in 2022 from 0.4 mn SQFT recorded in 2021 attributed to further increase of occupation of physical unserviced and serviced spaces at the back of full operations of businesses and organisations. We expect the occupancy rates to improve mainly attributed to resumption of working from office policies by most companies and reduced developments expected to enter the market in 2023 as compared to 2022. We these factors, we expect will potentially boost absorption rates by 10.0% to 1.1 mn SQFT in 2023, |
Positive |
Positive |
|
Office Market Performance |
The commercial office sector performance realized a slight improvement in its overall performance in FY’2021, with the average rental yields coming in at 7.3%, 0.3% points higher than 2020 which recorded 7.0%. The average occupancy rates also increased by 0.1% to 77.6%, from 77.7% recorded in 2020. The improvement in performance was mainly driven by an improved business environment following the lifting of the COVID-19 containment measures, as well as some businesses resuming full operations hence boosting the occupancy rates. However, the 6.7 mn SQFT oversupply in office spaces weighed down the performance of the sector in 2021 due to uncertainty occasioned by incoming general elections which slowed down business operations by most organisations. |
The average rental yield improved by 0.3% points to 7.6% in FY’2022 from 7.3% recorded in FY’2021, due to improved occupancy and rental rates. Average asking rents per SQFT in the NMA increased by 2.1% to Kshs 96 per SQFT from Kshs 94, owing to increased supply of Grade A offices fetching higher rents such as Karen Green and Global Trade Centre (GTC) Office Tower, among others. The overall occupancy rates increased by 1.8% points to 79.4% from 77.6% as a result of a slow but rising demand for physical space on the back of various firms resuming full operations, coupled with the expansion strategy by various firms such as Nairobi Garage and Call Centre International (CCI) Group. We expect sector performance to slightly record a positive increase in rental yields by 0.1% points to 7.7% in 2023 attributable to: i) increased trend in serviced office spaces, ii) slow but rising expansion in the sector after the peaceful general elections in 2022 and continuous traction of the economy towards pre-COVID-19 levels, and, iii) reduced developments in the pipeline which we expect will help curb the oversupply challenge and improving the absorption rates of available and fewer incoming spaces. We expect that this will boost occupancy rates and asking rents thereby improving average rental yields. However, the expected oversupply of office spaces at 5.8 mn SQFT in the NMA is expected to weigh down optimum performance of the sector by crippling the overall demand for physical space. |
Neutral |
Neutral |
We expect a neutral performance in 2023 unchanged from 2022. The sector will be mainly supported by the full resumption of operations by most firms and businesses at the back of improved economy from a peaceful electioneering period of 2022 and adjusting tractions towards pre-COVID-19 performance in the sector. We also expect increased uptake of the serviced office spaces which will potentially improve occupancy rates in the sector as more co-working space firms enter the market such as Regus, Kofisi, Office.co and many more. The increased evolution in the serviced spaces and competition by firms offering co-working space services have led to more creative ideas and diversification in use of vacant spaces such as niche-centred office spaces which are tailored according to specific genders, professions, mindsets, needs or shared interests of clients. However, the persisting oversupply of office spaces currently at 5.8 mn SQFT is expected to weigh down the overall occupancy rates and yields of the sector. Investment opportunity lies in Gigiri, Westlands and Karen supported by relatively low supply of office spaces, and high returns of 8.7%, 8.3%, and 8.3%, respectively, compared to the market average of 7.6%, as at FY’2022. For the full Commercial Office Report 2023, click here.
Disclaimer: The views expressed in this publication are those of the writers where particulars are not warranted. This publication, which is in compliance with Section 2 of the Capital Markets Authority Act Cap 485A, is meant for general information only and is not a warranty, representation, advice or solicitation of any nature. Readers are advised in all circumstances to seek the advice of a registered investment advisor


