Unit Trust Funds (UTFs) are Collective Investment Schemes that pool funds from different investors and are managed by professional fund managers. The fund managers invest the pooled funds in a portfolio of securities with the aim of generating returns to meet the specific objectives of the fund. Following the release of the Capital Markets Authority (CMA) Quarterly Statistical Bulletin – Q3’2021, we analyze the performance of Unit Trust Funds, as the total Assets Under Management (AUM) have been steadily increasing and they are among the most popular investment options in the Kenyan market. We will further analyze the performance of Money Market Funds, a product under Unit Trust Funds. In our previous focus on Unit Trust Funds, we looked at the Q1'2021 Unit Trust Funds Performance by Fund Managers. In this topical, we focus on the Q2’2021 performance of Unit Trust Funds where we shall analyze the following:
- Performance of the Unit Trust Funds Industry,
- Performance of Money Market Funds,
- Comparing Unit Trust Funds AUM Growth with other Markets, and,
- Recommendations
Section I: Performance of the Unit Trust Funds Industry
Unit Trust Funds are investment schemes that pool funds from investors and are managed by professional Fund Managers. The fund manager invests the pooled funds with the aim of generating returns in line with the specific objectives of the fund. The Unit Trust Funds earn returns in the form of dividends, interest income, rent and/or capital gains depending on the underlying security. The main types of Unit Trust Funds include:
- Money Market Funds – These are funds that invests in fixed income securities such as fixed deposits, treasury bills and bonds, commercial papers, etc. They are very liquid, have stable returns, and, they are suitable for risk averse investors,
- Equity Funds – These are funds which largely invest in listed securities and seek to offer superior returns over the medium to long-term by maximizing capital gains and dividend income. The funds invest in various sectors to reduce concentration of risk and maintain some portion of the fund’s cash in liquid fixed income investments to maintain liquidity and pay investors if need be without losing value,
- Balanced Funds – These are funds whose investments are diversified across the Equities and the Fixed Income market. The Balanced Fund offers investors long-term growth as well as reasonable levels of stability of income,
- Fixed Income Funds – These are funds which invest in interest-bearing securities, which include treasury bills, treasury bonds, preference shares, corporate bonds, loan stock, approved securities, notes and liquid assets consistent with the portfolio’s investment objective, and,
- Sector Specific Funds – These are funds that invest primarily in a particular sector or industry. The funds provide a greater measure of diversification within a given sector than may be otherwise possible for the other funds. They are specifically approved by the capital Markets Authority as they are not invested as per the set rules and regulations.
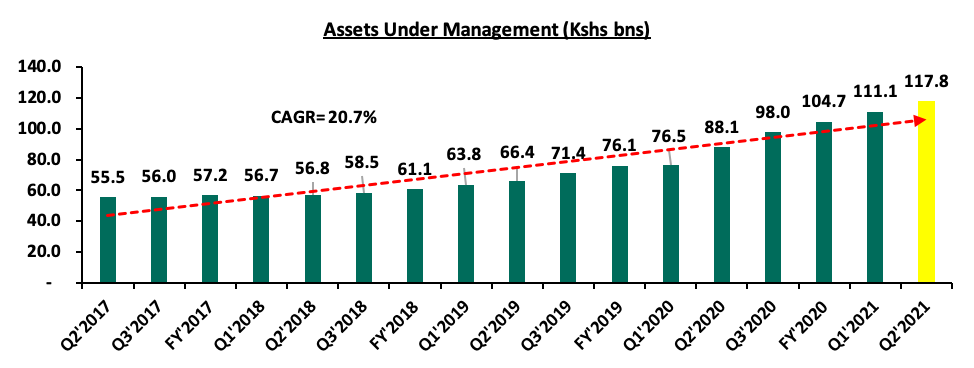
As per the Capital Markets Authority (CMA) Quarterly Statistical Bulletin – Q3’2021, the industry’s overall Assets Under Management (AUM) grew by 6.0% to Kshs 117.8 bn during the second quarter from Kshs 111.1 bn as at the end of Q1’2021. Assets Under Management of the Unit Trust Funds have grown at a 4-year CAGR of 20.7% to Kshs 117.8 bn in Q2’2021, from Kshs 55.5 bn recorded in Q2’2017.
This growth can be largely attributable to:
- Low Investments minimums for plain vanilla funds: Unit Trust Funds have become relatively affordable to retail investors, with a majority of the Collective Investment Schemes’ (CIS) in the market requiring an initial investment ranging between Kshs 100.0 - Kshs 10,000.0,
- Increased Investor Knowledge: There has been a drive towards investor education which has meant that more people are aware and have a deeper understanding of the investment subject. As a result, their confidence has been boosted and more of them are investing,
- Diversified product offering: Unit Trust Funds are also advantageous in terms of offering investors the opportunity of diversifying their portfolios by providing them with access to a wider range of investment securities through pooling of funds, which would have not been accessible if they invested on their own,
- Efficiency and ease of access to cash/High Liquidity: Funds invested in UTFs are invested as portfolios with different assets and the fund managers always maintain a cash buffer. They are relatively liquid and investors can get their cash on demand. Unit trusts are highly liquid, as it is easy to sell and buy units without depending on demand and supply at the time of investment or exit, and,
- Adoption of Fintech: Digitization and automation within the industry has enhanced liquidity, enabling investors to receive their funds within 3 to 5 working days if they are withdrawing to their bank accounts, and immediate access to funds when withdrawing via M-PESA. According to the Central Bank of Kenya, more and more individuals are transacting through mobile money services as evidenced by the increase in the total number of registered mobile money accounts to 68.1 mn in August 2021 from 66.6 mn recorded in January 2021. Fintech has increased the efficiency of processing both payments and investments for fund managers.
According to the Capital Markets Authority, as at the end of Q2’2021, there were 25 approved Collective Investment Schemes in Kenya. Out of the 25, however, only 19 were active while 6 were inactive. During the period under review, total Assets Under Management grew by 6.0% to Kshs 117.8 bn in Q2’2021, from Kshs 111.1 bn as at the end of Q1’2021. The table below outlines the performance of the Fund Managers:
|
Assets Under Management (AUM) for the Approved and Active Collective Investment Schemes |
||||||
|
No. |
Fund Managers |
Q1’2021 AUM (Kshs mns) |
Q1’2021 Market Share |
Q2’2021 AUM (Kshs mns) |
Q2’2021 Market Share |
AUM Growth Q1'2021-Q2'2021 |
|
1 |
CIC Asset Managers |
44,761.7 |
40.3% |
47,292.8 |
40.2% |
5.7% |
|
2 |
NCBA Unit Trust Scheme |
13,609.4 |
12.3% |
14,814.0 |
12.6% |
8.9% |
|
3 |
Britam |
14,150.3 |
12.7% |
14,429.4 |
12.3% |
2.0% |
|
4 |
ICEA Lion |
11,843.3 |
10.7% |
12,553.8 |
10.7% |
6.0% |
|
5 |
Sanlam Investments |
6,758.7 |
6.1% |
7,631.1 |
6.5% |
12.9% |
|
6 |
Old Mutual |
6,168.5 |
5.6% |
6,292.0 |
5.3% |
2.0% |
|
7 |
Dry Associates |
2,581.9 |
2.3% |
2,678.6 |
2.3% |
3.7% |
|
8 |
Nabo Capital (Centum) |
1,778.7 |
1.6% |
2,446.1 |
2.1% |
37.5% |
|
9 |
Madison Asset Managers |
1,896.8 |
1.7% |
1,972.1 |
1.7% |
4.0% |
|
10 |
African Alliance Kenya |
1,827.7 |
1.7% |
1,850.3 |
1.6% |
1.2% |
|
11 |
Zimele Asset Managers |
1,454.5 |
1.3% |
1,663.3 |
1.4% |
14.4% |
|
12 |
Co-op Trust Investment Services Limited |
1,371.9 |
1.2% |
1,500.9 |
1.3% |
9.4% |
|
13 |
Cytonn Asset Managers |
960.2 |
0.9% |
772.0 |
0.7% |
(19.6%) |
|
14 |
Genghis Capital |
645.5 |
0.6% |
683.8 |
0.6% |
5.9% |
|
15 |
Apollo Asset Managers |
685.8 |
0.6% |
634.8 |
0.5% |
(7.4%) |
|
16 |
Equity Investment Bank |
297.9 |
0.3% |
289.4 |
0.2% |
(2.9%) |
|
17 |
Alpha Africa Asset Managers |
216.4 |
0.2% |
222.0 |
0.2% |
2.6% |
|
18 |
Amana Capital |
75.6 |
0.1% |
45.1 |
0.0% |
(40.3%) |
|
19 |
Wanafunzi Investments |
0.6 |
0.0% |
0.6 |
0.0% |
3.9% |
|
20 |
Metropolitan Cannon Asset Managers |
- |
- |
- |
- |
- |
|
21 |
FCB Capital Limited |
- |
- |
- |
- |
- |
|
22 |
Fusion Investment Management Ltd |
- |
- |
- |
- |
- |
|
23 |
Standard Chartered Investment Services |
- |
- |
- |
- |
- |
|
24 |
Natbank Trustee & Investment Services |
- |
- |
- |
- |
- |
|
25 |
Absa Asset Management Ltd |
- |
- |
- |
- |
- |
|
Total |
111,085.3 |
100.0% |
117,771.8 |
100.0% |
6.0% |
|
Source: Capital Markets Authority: Quarterly Statistical Bulletin, Q3’2021
Key to note from the above table:
- Assets Under Management: CIC Asset Managers remained the largest overall Unit Trust Fund Manager with an AUM of Kshs 47.3 bn in Q2’2021, from an AUM of Kshs 44.8 bn in Q1’2021, translating to a 5.7% AUM growth,
- Market Share: CIC Asset Managers remained the largest overall Unit Trust with a market share of 40.2%, a marginal decline from 40.3% in Q1’2021. Key to note, Nabo Capital recorded the highest increase in its market share with the market share increasing to 2.1%, from 1.6% in Q1’2021, and,
- Growth: In terms of AUM growth, Nabo Capital recorded the strongest growth of 37.5%, with its AUM increasing to Kshs 2.4 bn, from Kshs 1.8 bn in Q1’2021 while Amana Capital recorded the largest decline, with its AUM declining by 40.3% to Kshs 45.1 mn in Q2’2021, from Kshs 75.6 mn in Q1’2021.
- Metropolitan Cannon Asset Managers, FCB Capital Limited, Fusion Investment Management Ltd, Standard Investment Trust, NatBank Trustee & Investment Services, and ABSA Asset Management Ltd remained inactive as at the end of Q2’2021.
Section II: Performance of Money Market Funds
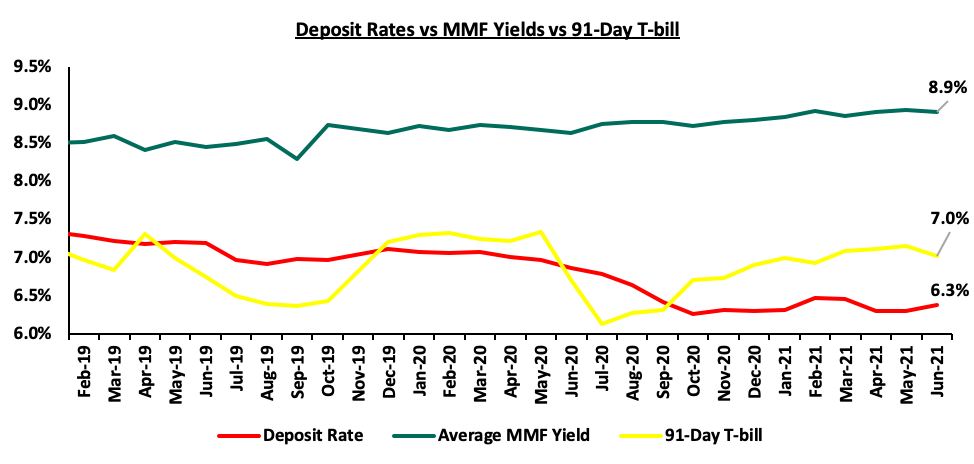
Money Market Funds (MMFs) in the recent past have gained popularity in Kenya, with one of the main reasons being the higher returns money market funds offer compared to the returns on bank deposits and treasury bills. According to the Central Bank of Kenya data, the average deposit rate during the year declined to 6.3% in Q2’2021, from an average of 6.4% recorded in Q1’2021. The average deposit rate and average 91-Day T-bill rate remained lower than the average MMF yields of 8.9%.
As per the regulations, funds in MMFs should be invested in liquid interest-bearing securities. These securities include bank deposits, securities listed on the Nairobi Securities Exchange (NSE), and securities issued by the Government of Kenya. The fund is best suited for investors who require a low-risk investment that offers capital stability, liquidity, and require a high-income yield. The fund is also a good safe haven for investors who wish to switch from a higher risk portfolio to a low risk portfolio, especially in times of uncertainty.
Top Five Money Market Funds by Yields
During the period under review, the following Money Market Funds had the highest average effective annual yield declared, with the Cytonn Money Market Fund having the highest effective annual yield at 10.5% against the industrial average of 8.9%.
|
Top 5 Money Market Fund Yield in Q2'2021 |
||
|
Rank |
Money Market Fund |
Effective Annual Rate (Average Q2'2021) |
|
1 |
Cytonn Money Market Fund |
10.5% |
|
2 |
Nabo Africa Money Market Fund |
10.1% |
|
3 |
Zimele Money Market Fund |
9.9% |
|
4 |
Orient Kasha Money Market Fund |
9.7% |
|
5 |
GenCapHela Imara Money Market Fund |
9.6% |
|
|
Industrial Average |
8.9% |
Section III: Comparing Unit Trust Funds AUM Growth with other Markets
Unit Trust Funds assets recorded a q/q growth of 6.0% in Q2’2021, while the listed bank deposits recorded a weighted growth of 18.4% over the same period. For both the Unit Trust Funds and bank deposits, this was lower than the values recorded as at Q2’2020 of 15.1% and 18.5%, respectively. The chart below highlights the Unit Trust Funds AUM growth vs bank deposits growth in Q2’2021;
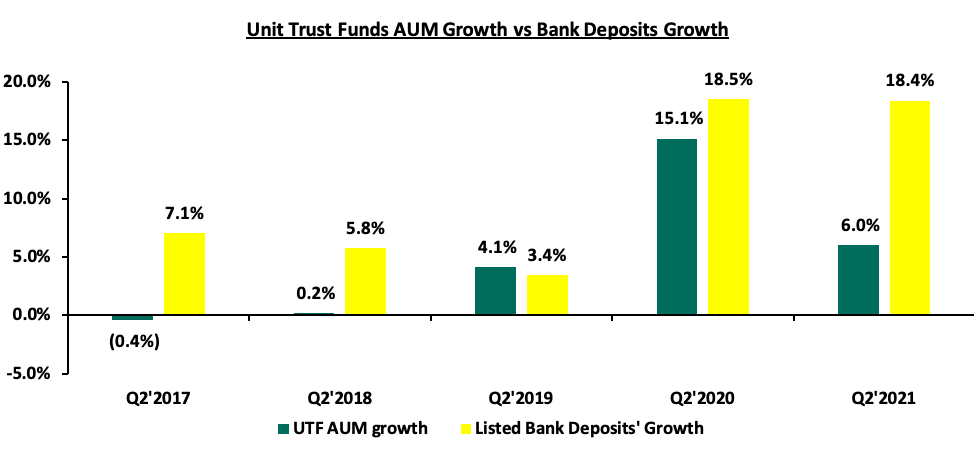
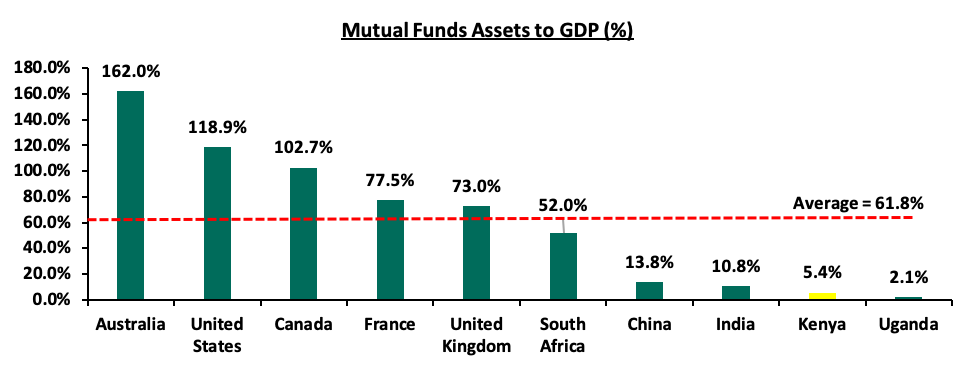
Bank deposit growth at 18.4% outpaced UTFs growth of 6.0%, and save for Q2’2019, bank deposit growth usually outpace UTFs growth, an indication that our capital markets potential and growth remains constrained. According to World Bank data, in well-functioning economies, businesses rely on bank funding for a mere 40.0%, with the larger percentage of 60.0% coming from the Capital markets. Closer home, CMA notes that in 2020, businesses in Kenya relied on banks for 95.0% of their funding while less than 5.0% came from the capital markets. Notably, our Mutual Funds/UTFs to GDP ratio at 5.4% is still very low compared to global average of 61.8%, indicating that we still have room to improve and enhance our capital markets. The table below shows some countries’ mutual funds as a percentage of GDP:
Source: World Bank Data
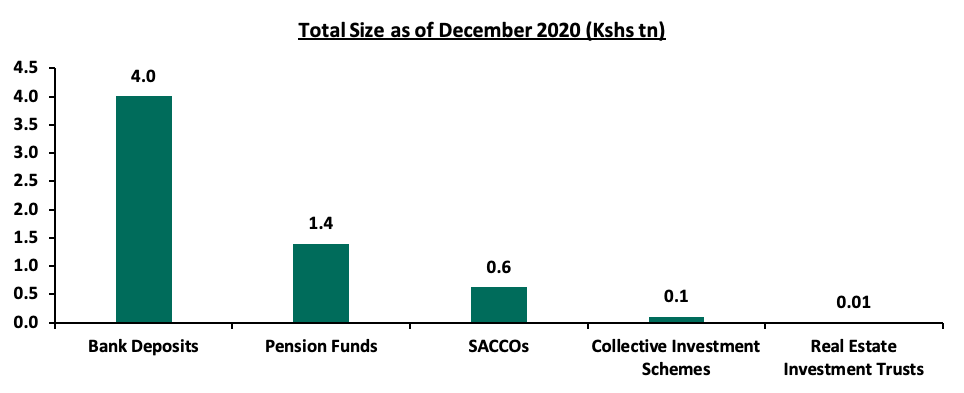
Over the past 4 years, the UTFs AUM has grown at a CAGR of 20.7% to Kshs 117.8 bn in Q2’2021, from Kshs 55.5 bn recorded in Q2’2017. However, even at Kshs 117.8 bn, the industry is dwarfed by asset gatherers such as bank deposits at Kshs 4.0 tn and the pension industry at Kshs 1.4 tn as of the end of 2020. Below is a graph showing the sizes of different saving channels and capital market products in Kenya as at December 2020:
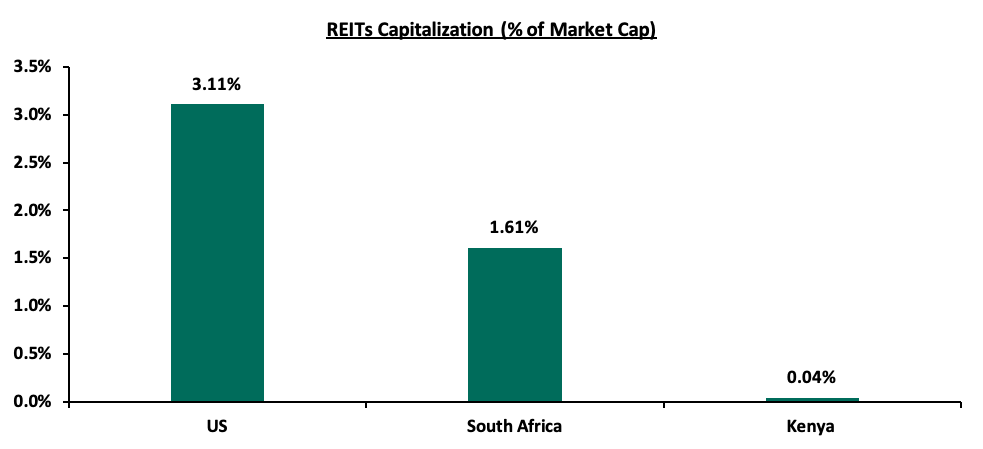
On a REITs to Market Cap Ratio, Kenya also still has a lot of room for improvement. The listed REITs capitalization as a percentage of Total market cap in the US stands at 3.11% compared to 1.61% in South Africa and 0.04% in Kenya. Below is a graph showing comparison of Kenya’s REITs to Market Cap Ratio to that of United States (US) and South Africa:
Section IV: Recommendations
In order to improve our Capital Markets and stimulate its growth, we recommend the following actions:
- Provide Support to Fund Managers: We believe that the regulator, CMA, needs to include market stabilization tools as part of the regulations/Act that will help Fund Managers meet fund obligations during times of distress – such as mass withdrawals. We do commend the regulator on its role on protecting investor interests. However, since Fund Managers also play a key role in the capital markets, the regulator should also be able to protect the brand image of various fund managers in the industry. We believe that working together with industry players to resolve matters rather than alienating and publicly ostracizing industry players facing challenges may not particularly be in investors’ interest,
- Allow for sector funds: The current capital markets regulations require that funds must diversify. Consequently, one has to seek special dispensation in the form of sector funds such as a financial services fund, a technology fund or a real estate UTF fund. Regulations allowing unit holders to invest in sector funds would expand the scope of unit holders interested in investing,
- Reduce the minimum investments to reasonable amounts: Currently, the minimum investment for sector specific funds is Kshs 1.0 mn, while that for Development REITS is currently at Kshs 5.0 mn. The high minimum initial and top up investments amounts are unreasonably high given that the national median income for employed individuals is estimated at around Kshs 50,000. It therefore locks out a lot of potential investors. Additionally, these high amounts discriminate against most retail investors, giving them fewer investment choices. This is the key reason why the listed REITS to Market cap ratio for Kenya remains at 0.04% compared to South Africa at 1.61% and US at 3.11%,
- Eliminate conflicts of interest in the governance of capital markets: The capital markets regulations should enable a governance structure that is more responsive to market participants and market growth. Specifically, restricting Trustees of Unit Trust Schemes to Banks only limits choices, especially given that banking markets and capital markets are in competition,
- Create increased competition in the market by encouraging different players to set up shop and offer different services such as the opening up of Trustees to non-financial institutions: Competition in capital markets will not only push Unit Trust Fund managers to provide higher returns for investors but will also eliminate conflicts of interest in markets and enhance the provision of innovative products and services, and,
- Improve fund transparency to provide investors with more information: Each Unit Trust Fund should be required to publish their portfolio holdings on a quarterly basis and make the information available to the public so as to enhance transparency for investors. Providing investors with more information will help both investors and prospects make better informed decisions and subsequently improve investor confidence.
During Q3’2021, we saw the Capital Markets Authority (CMA) publish two draft regulations; the Capital Markets (Collective Investment Schemes) Regulations 2021 and the Capital Markets (Collective Investment Schemes) (Alternative Investment Funds) Regulations 2021. The proposed regulations seek to update the current Collective Investment Scheme Regulations given the change in market dynamics since the last published Regulations in 2001, as well as address emerging issues. The move by CMA to review the current regulations is welcomed as it seems intended to improve the Capital Markets in Kenya by providing more versatile regulations and provide for existence of regulated funds that invest in alternative asset classes. However, it’s our view that proceeding with the regulations as proposed would not be ideal for the market. In our Draft CMA Investments Regulations topical, we analyzed these regulations and thereafter gave our recommendations on the areas of improvement. We await to hear back from CMA as to the next steps with regard to the draft regulations.
Disclaimer: The views expressed in this publication are those of the writers where particulars are not warranted. This publication, which is in compliance with Section 2 of the Capital Markets Authority Act Cap 485A, is meant for general information only and is not a warranty, representation, advice or solicitation of any nature. Readers are advised in all circumstances to seek the advice of a registered investment advisor.


